Children Who Primarily Attended Early Childcare Centers Before Kindergarten Start School Stronger in Math, Reading

Young children who attended day care, preschool and other types of center-based care in the year before kindergarten earned higher scores in math and reading and had stronger learning and cognitive flexibility skills than their peers who did not participate in such activities, according to a national report by Institute of Education Sciences (IES). The study revealed racial and ethnic disparities in early care arrangements. The percentages of first-time kindergartners who received center-based care as their primary early care and education arrangement the year before kindergarten were lower for Hispanics (48%) and Pacific Islanders (28%) than for whites (58%), blacks (56%), Asians (62%), American Indians/Alaska Natives (57%) and kindergartners of two or more races (61%).cover

About 36 percent of kindergartners from households where a primary language other than English was spoken had no regular early care and education arrangement in the year before kindergarten, compared with 18 percent of kindergartners whose primary home language was English. The data of the study, released this year, is from the fall of 2010.

The 60-page report, produced by the American Institutes for Research (AIR) for the U.S. Department of Education’s National Center for Education Statistics (NCES), drew from a nationally representative sample of U.S. kindergartners as they entered school.

Connecticut's Office of Early Childhood, established in 2014, notes that "Study after study confirms the value of high-quality early childhood education for developing the cognitive, social and emotional skills that children need to succeed in kindergarten."

Major findings from the study, which examined children’s performance as they entered kindergarten in fall 2010, include the following:

childrenReading: children who had no regular early care and education arrangements the year before kindergarten and those whose primary arrangements were home-based relative care or non-relative care tended to score lower than children who were primarily in center-based care or who spent the same amount of time in multiple care arrangements.

Math: children who had no regular early care and education arrangements the year before kindergarten tended to score lower than children who attended any type of arrangement outside of parental care. Children who were primarily in home-based relative care scored lower than children who were primarily in home-based non-relative care, center-based care or multiple care arrangements for equal amounts of time.

Cognitive flexibility scores were lower, on average, for children who had no regular early care and education arrangements the year before kindergarten and for those whose primary arrangements were home-based relative care than for children who primarily attended center-based care. (These scores measure a child’s ability to adjust behavior or attention in response to changes in the environment.)

Approaches to learning—in which teachers rated students on attentiveness, task persistence, eagerness to learn, learning independence, flexibility, organization and ability to follow classroom rules—tended to be lower for children who had no regular early care and education arrangements the year before kindergarten than for those who were primarily in home-based non-relative care, center-based care or multiple care arrangements for the same amount of time.

The report examined five categories of primary early care and education arrangements for children:

  1. center-based care, including day care centers, Head Start programs, preschool, prekindergarten and other early childhood programs;
  2. home-based relative care;
  3. home-based non-relative care;
  4. multiple arrangements for equal amounts of time;
  5. no regular early care arrangement (i.e., mainly parental care only)

It found that the percentage of children who attended center-based care as their primary arrangement before kindergarten has increased only slightly over nearly two decades, from 55 percent in 1995 to 58 percent in 2012.

The American Institutes for Research (AIR) is a nonpartisan, not-for-profit organization that conducts behavioral and social science research and delivers technical assistance both domestically and internationally in the areas of health, education and workforce productivity.


https://youtu.be/bs_Svx6JPro

Digital Citizenship Summit, Born in CT, Grows on Twitter

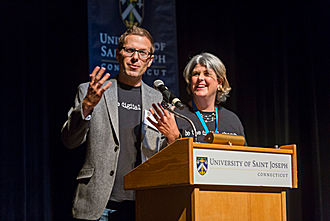
A year ago, the first annual Digital Citizenship Summit was held in West Hartford, hosted by the University of Saint Joseph.  This Friday, the second annual Summit will be held in San Francisco, hosted by Twitter at their global headquarters.  The livestream is expected to reach 3.2 million people globally via Twitter Livestream. The mission of the initiative hasn’t changed as the reach has grown - to unite people, organizations, and companies around the world committed to the safe, savvy, and ethical use of social media and technology. The Digital Citizenship Summit, being held on October 28, is described as a global event, with speakers from Australia, Spain, England, Ireland, Canada, and Kenya.  Attendance can be in-person or virtual.digcitsummit-logo-twitter

The event includes a diverse range of well-known and emerging voices with “quick and powerful” 10-minute talks, along with a range of panels covering the breadth of digital citizenship.  The three themes for the Summit are: Citizenship, Literacy, and Advocacy.

Organizers say “the Digital Citizenship Summit isn’t a conference, it is a movement - away from fear and distrust, and towards educating, empowering and engaging all groups.”  The Summit will share best practices and insights, and promote collaboration, bringing together educators, parents, students, organizations and industry.

The initiative was launched by West Hartford’s David Ryan Polgar and academician Marialice B.F.X. Curran.  Dr. Curran's teaching, scholarship and service focus on digital citizenship and social media in K-12 teacher education. She was named one of the Top 10 Digital Citize65ea16_1edb198f98dd4c51bfd32665595a5f99-mv2nship bloggers to follow in 2014 by Common Sense Media. Polgar, an attorney and college professor, is a frequent speaker (three-time TEDx) and tech commentator on television and in print, focusing on digital citizenship, creativity, cyber ethics, tech balance and humanizing the online experience.

“Millions of people are struggling with modeling safe, savvy and ethical behavior online.  Beneath the surface, there are major conflicts between parents, students, educators and administrators that span personal safety to politics.  The Digital Citizenship Summit bridges the gap between what we want to see online and how to actually be the digital change,” organizers point out.

The event will be emceed by Kelly Wallace, a digital correspondent and editor-at-large for CNN. It is also serving as the kick-off for US Media Literacy Week. The Digital Citizenship Summit will be livestreaming from Twitter headquarters from 9 AM PST to 5:00 PM PST. It can be seen on the Summit website or from Twitter's @Safety account. Individuals do not need to register in order to watch the live stream, but all registrants will receive post-event videos and resources, according to organizers.

2fbe44_14adf49eed2f4d16a1a2b224de945ee0-mv2Joining internationally renowned speakers, there will be student voices – “passionate voices from elementary school students to college-age advocates who are already leading us into the future as positive role models.”  Among the speakers is Jim Steyer, Founder and Chief Executive Officer of Common Sense Media, the nation’s leading non-partisan organization dedicated to improving media and technology choices for kids and families. He is also the Co-Founder and Chairman of the Center for the Next Generation.

In addition to the annual flagship summit event, past digital summits have been held in Ireland and the United Kingdom, with plans for a summit in Australia later this year.

Javier Colon Music Video Collaboration for NASA Takes Off, Includes CT Science Center, UHart

An Atlas V rocket blasted off with NASA's Lunar Reconnaissance Orbiter from Cape Canaveral in Florida on June 18, 2009. Two years later, on June 29, 2011, West Hartford’s Javier Colon won the inaugural season of the NBC-TV hit “The Voice.” It’s doubtful that anyone would have predicted that the trajectories of those two orbits would coincide.webpage

However, they have – with the release this month of a new music video co-performed by Colon, along with Matt Cusson.  The new song, “The Moon and More,” was inspired by the Lunar Reconnaissance Orbiter (LRO) mission, and produced in collaboration with NASA’s Goddard Space Flight Center in Greenbelt, Maryland and veteran video producer/editor David Ladd.

Colon, who earned a Bachelor of Music in Music Education from the Hartt School at the University of Hartford, said: “This project brought me back to when I was a kid watching NASA launch the shuttle missions.  Every kid at some point wants to fly, and I think that dream has a lot to do with NASA’s exploration of space and discoveries.”

The song and music video focuses on the inspirational nature of studying the moon -- the cornerstone to learning more about the solar system -- and how LRO has ushered in a new era of lunar science. The mission is expected to relay more information about the lunar environment than any other previous mission to the moon.javier_and_matt_still_image_print

The video appears on the NASA LRO website, and is available on You Tube, where comments have been overwhelmingly positive, and numerous space exploration websites.  Filming locations included the Hartt School of the University of Hartford and Connecticut Science Center;  the Intrepid Sea, Air and Space Museum in New York; the National Air and Space Museum in Washington, D.C.; and the “Living on Mars” mural in the Bronx, New York.

“I wanted to create a unique production for the LRO mission that centered around music as a way to engage kids, parents and educators,” said Ladd. “A major focus was also to convey an important and encouraging message to kids, particularly children of color—that nothing is beyond their reach. You can achieve the goals you set and take yourself to places you never thought possible — just as NASA has done in going back to the moon with LRO and its continued journey into the solar system.”

Ladd conceived of the project, and selected Cusson and Colon to write the song and perform the music.  The project came together with a strong sense of destiny.  Ladd had heard Cusson’s music previously, through a mutual friend, and had been of fan of Colon’s since the voice.  When he contacted Cusson to gauge his interest, he learned that Cusson and Colon were friends, musically and otherwise.  The connection was made, and Cusson and Colon set out to create a song that matched – or, as it turned out, exceeded, the story board that Ladd had in mind.

nasalogo-570x450“I picked out five of each of their songs that I liked, and that I thought had a sound that would work.  Then I let them have at it.” Ladd recalled.  When he received the first rough videos from them of the words and music, his response was succinct:  “This is perfect.  Keep running with it.”

They did, and the song was completed earlier this year and debuted in recent weeks.  Ladd hopes the song will boost awareness of the LRO, and transcend it.  “Some have described it as the ‘Frozen’ of space exploration in its majestic feel.  We hope it will have broad appeal, a song that you’ll enjoy on the radio, and be inspired by.”photo

Ladd explained that the casting in the music video, which features people of color (including members of the same family to highlight authenticity) was intentional, so that “kids that don’t always see themselves,” can better connect to the possibilities that science and exploration can offer. (PHOTO:  Javier Colon, David Ladd, Matt Cusson)

The LRO mission team believes “The Moon and More” will have a lasting impact, adding a popular element to an array of education programs that are already part of the LRO mission. The LRO Lunar Workshops for Educators are an award-winning professional development program focused on lunar science and exploration for grade 6-9 science teachers, and programs for grade levels beginning with elementary school have been made available to teachers nationwide.

“It was exciting to have this chance to work with NASA,” said Cusson, a Pittsfield, MA native. “As a musician, you don’t usually think that this is something you could do. But I was honored to offer up my skills and music, and to bring the worlds of science and music together.”

“A number of us working on LRO have had something inspire us to pursue careers in science and engineering,” said LRO Deputy Project Scientist Noah Petro at Goddard. “This video serves as an opportunity to inspire future generations to follow their dreams into the sciences or the arts.”  Ladd expressed appreciation for the supportive efforts of both the Hartt School and the Connecticut Science Center, and indicated that some of the videos best segments were filmed at the Connecticut locations.346876main_lrologo_full

LRO is managed by NASA's Goddard Space Flight Center in Greenbelt, Maryland, as a project under NASA’s Discovery Program. The Discovery Program is managed by NASA’s Marshall Spaceflight Center in Huntsville, Alabama, for the Science Mission Directorate at NASA Headquarters in Washington, D.C.

https://youtu.be/PPB1ZHb9FKA


Almond Joy, Born in Connecticut, Is State's Candy Sales Champion

Almond Joy, Milky Way and M&Ms are the likely candies to be greeting Connecticut trick-or-treaters as they move from door to door later this month.  That’s according to candystore.com, which sells bulk candy on-line, in their review of sales data from 2007 through 2015.ct-joy Connecticut's favorite Halloween candy is Almond Joy, with 2,619 pounds of it, on average, ordered each year, the website indicated. Milky Way is Connecticut's second favorite Halloween candy, with 1,366 pounds ordered. M&M's placed third, at 910 pounds on average.

Among Connecticut’s neighboring states, the candy favorite in Massachusetts is Butterfingers; in New York it is Sour Patch Kids, in Rhode Island candy corn topped the list.  Connecticut was the only state where Almond Joy ranked first in candy sales.

Industry research shows that since 2015, online candy sales have increased by 15 percent, according to candystore.com.

The Almond Joy candy bar was introduced in 1946, just after the World War II, when sugar, tropical coconuts and chocolate became more readily available, by the New Haven-based Peter Paul Manufacturing Company,  which was already well-known for its popular Mounds bar introduced in 1921. Today, the Peter Paul Candy Manufacturing Company is a candy-making division within the Hershey Company. It was originally founded in the Elm City in 1919 by six Armenian immigrants led by Peter Paul Halajian, with a manufacturing plant in nearby Naugatuck.

"Almond Joy has seen a resurgence in popularity over the past few years.  No where is that more apparent than Connecticut.  While it cracked the top 3 in a few other states (MN, SD, TX), it was the #1 candy in Connecticut, " said co-CEO of CandyStore.com, Tom Hoeck.

CandyStore.com is an industry leader in candy sales in the United States and Canada, and offers candies of all shapes, sizes, colors, and brands. To determine the best sellers by state, the company reviewed sales from 2007–2015, focusing on the three months leading up to Halloween.candy-map

“Since we sell candy to all 50 states (and Canada), it was easy for us to see a state-by-state breakdown of candy trends and top orders. And we have relationships with all the major candy companies, so they helped us verify as well. Based on this analysis, we determined the Halloween best-sellers that people all over the country love to use in Halloween crafts and treats and give out to trick-or-treaters.”

The company also provides “candy trivia” on its website, noting that during the 1981 inauguration of Ronald Reagan, three tons of jelly beans were served, candy corn is the top selling candy, and two-thirds of American candy bars were introduced more than 50 years ago.

Nationwide, Parents Seek Expanded Health Curriculum in Schools

In Connecticut, a planned, sequential PK-12 Coordinated School Health (CSH) education curriculum is a system designed to addresses the physical, mental, emotional and social dimensions of health.  CSH aims to improve students’ health and their capacity to learn through the support of families, communities and schools working together. A new nationwide survey indicates that the broader, comprehensive definition of health education is precisely what families are seeking in the health education of children.  Teaching kids about drugs, alcohol and sex appears to be less controversial than ever before with the majority of parents in a new poll saying schools should and do teach these subjects.school-health

Many parents want more — saying those topics are not enough — finds the University of Michigan C.S. Mott Children’s Hospital National Poll on Children’s Health. Researchers surveyed a nationally representative sample of parents with kids in middle or high school. Two-thirds of parents polled say schools should definitely cover emotional and mental health issues — which may include such subjects as dealing with depression, stress and bullying — yet only a third say these topics are currently covered by their child’s school.  Another 68 percent of parents want to see schools cover basic first aid, and 63 percent say kids should learn CPR.umh_c_mottpoll_healthed_supportvisual1x

A coordinated approach to school health aligns health and education efforts and leads to improved physical, mental and developmental outcomes for students, according to the State Department of Education (SDE) website. The department’s overview of the program indicates that “Students’ physical, social and emotional development requires the same level of ongoing assessment and support as their academic development.”

“Research has consistently concluded that student health and academic achievement are directly connected and, in fact, that student health is one of the most significant influences on learning and achievement,” SDE points out.

In the national survey, parents “clearly perceive a gap between what their children need and what they are receiving in the area of mental health education, as well as basic first aid and CPR,” says Sarah Clark, M.P.H., co-director of the C.S. Mott Children’s Hospital National Poll on Children’s Health.  “We are seeing increasing concerns for such issues as stress, depression and suicide among young people, and parents want schools to be a part of the solution. These results suggest that the stigma of mental health issues may have relaxed among today’s parents, in favor of using a broad array of resources to help children and adolescents with these critical areas.”

The Connecticut curriculum is designed to “motivate children and youth to maintain and improve their health, prevent disease, reduce health-related risk behaviors and develop and demonstrate health-related knowledge, attitudes, skills and practices.”

Nearly four in 10 parents (39 percent) in the Mott survey believe schools should educate students on how to use the health care system. But only one in 10 parents say the topic is covered in their child’s school. Low-income parents are more likely to say schools should teach students how to use the health care system—perhaps, Clark notes, because these parents face challenges themselves in accessing health care.  The survey does not include a state-by-state breakdown of the data.

Obesity Rate Climbs in Connecticut, Is Among the Nation's Lowest

Connecticut now has the 10th lowest adult obesity rate in the nation, according to The State of Obesity: Better Policies for a Healthier America. Connecticut's adult obesity rate is currently 25.3 percent, up from 16.0 percent in 2000 and from 10.4 percent in 1990.42

reportAccording to the most recent data, adult obesity rates now exceed 35 percent in four states, 30 percent in 25 states and are above 20 percent in all states. Louisiana has the highest adult obesity rate at 36.2 percent and Colorado has the lowest at 20.2 percent.
U.S. adult obesity rates decreased in four states (Minnesota, Montana, New York and Ohio), increased in two (Kansas and Kentucky) and remained stable in the rest, between 2014 and 2015. This marks the first time in the past decade that any states have experienced decreases — aside from a decline in Washington, D.C. in 2010.

The data, released in September 2016 by the Trust for America’s Health and the Robert Wood Johnson Foundation, reflects information compiled nationwide in 2015.

Connecticut’s childhood obesity rates are 15.8 percent for 2-to-4 year olds from low-income families, 15 percent of 10-17 year olds, and 12.3 percent of high school students.

Regarding obesity-related health issues, Connecticut ranked 31st among the states in the current adult diabetes rate, which is 9.3 percent, and 30th in hypertension at 30.4 percent of the population. rate

In 1985, no state had an adult obesity rate higher than 15 percent; in 1991, no state was over 20 percent; in 2000, no state was over 25 percent; and, in 2006, only Mississippi and West Virginia were above 31 percent.  Nationwide, obesity rates are higher among women (40.4 percent) compared to men (35.0 percent).


Efforts to Improve Math Education in CT Don't Yet Add Up, Report Finds

If Connecticut students are to excel in math, it will take a concerted effort at the state and district level, revised curriculum by state colleges preparing math teachers, and greater community involvement.  That overall effort, according to a new state report, still has a ways to go. The 30-member Commissioner’s Council on Mathematics report, issued last week, outlines recommendations for educators, policy leaders, and community members to improve K-12 mathematics education in the state.  The report stresses several recommendations that are grounded in the lessons learned regarding strong leadership, quality professional development, dedicated time, and effective collaboration within, among, and beyond school districts.report

The council outlines several specific actions for the State Department of Education, individual school districts, higher education, and the community in the report that are distilled into four broad recommendations. Each recommendation is evidence-based, actionable, inclusive of all stakeholders, and measurable.

The four broad recommendations are:

  • develop a clear and consistent understanding of the Connecticut Core Standards-Mathematics (CCS-M) at the classroom, school, district, and state levels;
  • provide the support and training necessary to effectively implement the mathematics standards with fidelity in all classrooms, schools, and districts;
  • implement appropriate interventions and acceleration to support the needs of a diverse group of learners; and
  • engage all stakeholders in the process of putting the Connecticut Core Standards-Mathematics into practice through effective communication that keeps teachers, parents and community members informed and participating in the process.

kids-in-class“Every student deserves the opportunity to receive a math education that is rich and rigorous, and equips them with the skills needed to graduate from high school prepared to be successful in both college and career,” said Commissioner Wentzell. “These recommendations by the Council on Mathematics have created a clear path that will help the State Department of Education take the steps needed to ensure that every student in our state receives a high-quality mathematics education.”

Next steps identified in the report include that “all stakeholders need to work and learn more in the area of mathematics education,” specifically as it relates to the following:

  • instructional support necessary for students with special needs to access the standards;
  • instructional support necessary for English learners to access the standards;
  • interconnectedness of curriculum, instruction, and assessment; and
  • teacher evaluation and certification requirements.

The framework for the recommendations was a logic model described as four buckets: Deep Knowledge of the CCS-M, Curriculum Development and Implementation, Intervention and Acceleration, Community and Family Engagement.

The Commissioner’s Council on Mathematics was initiated by Commissioner Wentzell in 2015 in response to the Smarter Balanced test results in mathematics. The council was convened to spearhead the state’s efforts to improve supports in mathematics by identifying best practices and exploring promising innovations in mathematics instruction.

Communities are urged, in some of the recommendations, to establish partnerships with local districts to create internships for high school students with businesses that require mathematics skills, use social media and distribution lists to promote the importance of the CCS-M, and urge community members to attend and participate in state- and district-provided workshops that deliver information about the standards.

Among a series of recommendations aimed at higher education, colleges are urged to:kids-computer

  • Increase mathematics coursework for elementary pre-service teachers.
  • Increase coursework that focuses on the mathematical practices at all levels.
  • Collaborate with district partners to ensure that pre-service teachers’ field experience is with a teacher who exhibits conceptual understanding, deep content knowledge, and effective use of the practices.
  • Mentor teachers and provide training specific to mathematics content and pedagogy to teachers who will be assigned a pre-service teacher.
  • Create professional learning workshops for in-service teachers to interact with professors at the university to make the connections of what is being taught at the K-12 level and how it is used in higher education.
  • Build relationships with high schools by promoting early college experiences in high schools
  • Require coursework in family engagement strategies for pre-service teachers.

math-quizCouncil members included parents, teachers, curriculum specialists, principals, superintendents, board of education members, higher education professors, business leaders, and State Department of Education staff members with the purpose of closely examining the current state of mathematics education in Connecticut.
The Commissioner selected the members through recommendations made by various stakeholder groups across the state, including the Connecticut Parent Teacher Association (CT-PTA), the American Federation of Teachers-Connecticut (AFT-CT), the Connecticut Education Association (CEA), the Connecticut Association of Schools (CAS), the Connecticut Business & Industry Association (CBIA), and the Connecticut State Department of Education (CSDE).  They met monthly from February 2016 to June 2016, and the recommendations were developed with the input of local school districts, higher education, and experts in family and community relations, according to the report.

CT Families Continue to Struggle Financially, United Way Report Reveals

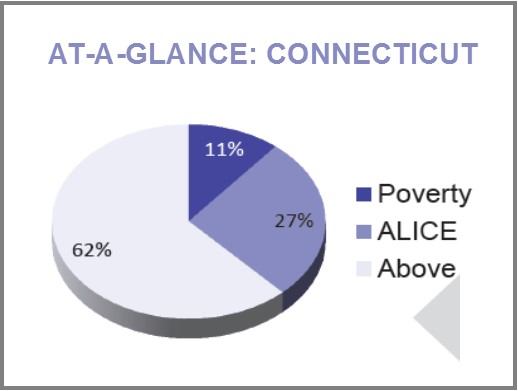
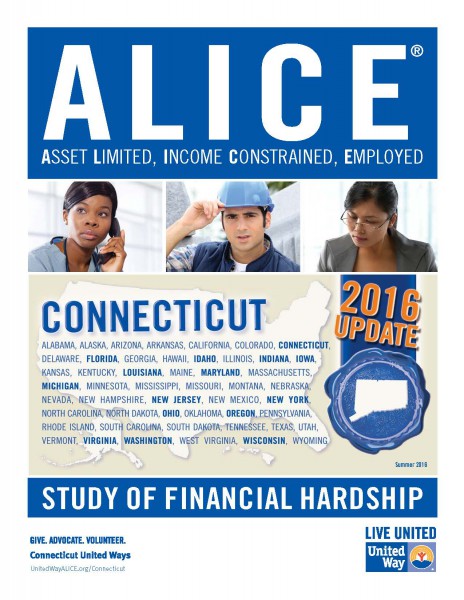
More Connecticut households are struggling to pay for their most basic needs, according to a new report from United Way.  More than one out of four households - in one of the wealthiest states in the U.S. - are employed, yet still fall below what is needed to thrive financially.  That is an increase in both the number and percentage of such households in 2014 as compared with 2012, according to the updated ALICE report. Two years ago, United Ways introduced ALICE, which stands for - Asset Limited Income Constrained Employed - to place a spotlight on a large population of residents who are working, but have difficulty affording the basic necessities of housing, food, child care, health care and transportation.pie

In those two years, the problem has grown worse, even has the recession has given way to a slow economic recovery, in Connecticut and nationwide.  ALICE and poverty households combined account for 38 percent of households in the state that struggle to make ends meet.

A total of 361,521 Connecticut households fall into what the study describes as the ALICE population. These are households earning more than the official U.S. poverty level, but less than the basic cost of living. This is more than 2.5 times the number of households that fall below the federal poverty level. ALICE households make up 20% or more of all households in 114 (67%) of Connecticut’s 169 cities and towns.

The highest levels (ALICE and poverty households) were in Hartford (74%), New Haven (65%), Waterbury (63%), Bridgeport (63%) and New Britain (63%).  Also above 50 percent are Meriden, West Haven, East Hartford and New London.  From 2007 to 2014, two cities, Danbury and Waterbury, saw their total household population decrease, by 7 and 9 percent respectively, while the rest experienced an increase in households, with the largest increase of 8 percent in Stamford, according to the report. The number of household below the ALICE Threshold increased in every one of the nine largest cities and towns with Norwalk seeing the largest percent increase (38 percent).

2016-alice-report-update-coverWhile the prevalence of low-wage jobs still defines Connecticut’s economy for ALICE, for the first time in the past decade, the percent of jobs paying less than $20 per hour fell below 50 percent of all jobs.  The report also highlights a number of trends in Connecticut, including:

  • The population is aging, and many seniors do not have the resources they need to support themselves.
  • Differences by race and ethnicity persist and ethnicity persist, creating challenges for many ALICE families, as well as for immigrants in Connecticut.
  • Low-wage jobs are projected to grow faster than higher-wage jobs over the next decade.
  • Technology is changing the workplace, adding some jobs, replacing many others, while also changing where people work, the hours they work, and skills required. The report notes that technology creates opportunities as well as challenges for ALICE workers.

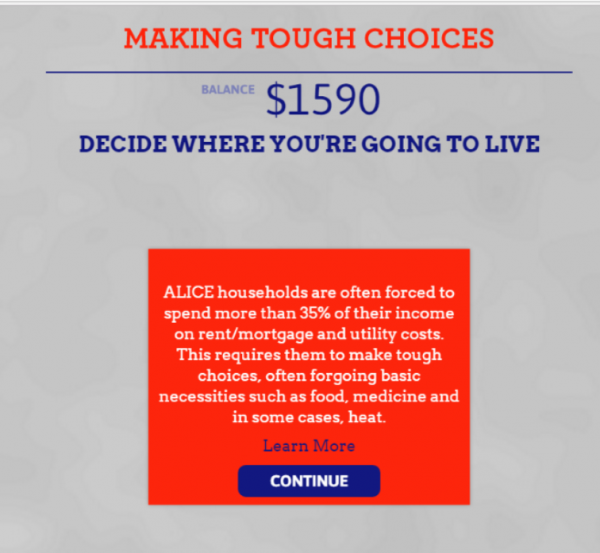
For the first time, an online simulator is also available to experience the financial challenges that ALICE households in Connecticut face at www.MakingToughChoices.org.  The updated Report uses data from a variety of sources, including the U.S. Census and the American Community Survey to provide tools that quantify the number of households in Connecticut's workforce that are struggling financially. The updated United Way ALICE Report reveals:

  • The composition of the ALICE population is men and women, young and old, of all races.
  • The breakdown of jobs in Connecticut by hourly wage (51% of jobs pay more than $20/hour) compared to what it costs to survive for a family of four (2 adults, 1 infant, 1 preschooler) - $70,788.
  • Every city and town in Connecticut has ALICE households. More than two-thirds of Connecticut's cities and towns have at least 1 in 5 households that fit the ALICE definition for financial hardship.cropped-alicemicrositelogo2

Poverty and ALICE households exist in every racial and ethnic group in Connecticut, but the largest numbers are among White non-Hispanic households. There were about one million White households in 2014, compared to 328,000 households of color (Figure 4 shows the populations of color for whom there is income data: Hispanic, Black and Asian). However, these groups made up a proportionally larger share of households both in poverty and ALICE: 64 percent of Hispanic households, 58 percent of Black households, and 30 percent of Asian households had income below the ALICE Threshold in 2014, compared to 31 percent of White households.

The largest population of color in Connecticut, Hispanics, has been growing since 2007, totaling 156,837 households in 2014, a 25 percent increase. As the number of Hispanic households increased, so did the number and proportion of Hispanics living below the ALICE threshold. The percentage of Hispanic ALICE households rose from 34 percent in 2007 to 39 percent in 2010 and then to 43 percent in 2014. Together Hispanic households in poverty and ALICE made up more than two-thirds of Hispanic households in 2014.

making-tough-choicesThere are some signs of improvement in the education gap among racial and ethnic groups, suggesting that some structural changes are occurring in Connecticut. In K-12 education, the Education Equality Index (EEI) shows that the achievement gap – the disparity in educational measures between socioeconomic and racial or ethnic groups – narrowed slightly between 2011 and 2014 in Connecticut.

Achievement gaps impact graduation rates and college performance. Among the Class of 2013, 64 percent of Black students and 59 percent of Hispanic students in the state went on to college within a year after graduating from high school, compared to 78 percent of White students. They also had lower 6-year college graduation rates: While 54 percent of White students got a college degree within 6 years, only 24 percent of Black students and 21 percent of Hispanic students did the same (Connecticut State Department of Education, 2015).

The updated ALICE Report recommends both short-term and long-term strategies to help ALICE families and strengthen our communities. United Ways work with many community partners to provide support to ALICE families to help them get through a crisis and avoid a downward spiral into even worse circumstances such as homelessness as well as assisting with financial literacy, education and workforce readiness.

Further, United Ways in Connecticut have invested more than $8.5 million in child care and early learning; $1.3 million in housing and homeless prevention work; $5 million in basic needs programs; and, have assisted working families in obtaining nearly $40 million in EITC and tax refunds and credits in 2016.

The updated Connecticut ALICE Report was funded by the 16 Connecticut United Ways. For more information or to find data about ALICE in local communities, visit http://alice.ctunitedway.org.  Connecticut United Ways are joining with United Ways in fifteen other states to provide statewide ALICE Reports. The updated Connecticut ALICE Report provides analysis of how many households are struggling in every town, and what it costs to pay for basic necessities in different parts of the state (Household Survival Budget).

https://youtu.be/u7gPJGu2psw

 [2014 ALICE introductory video]

Global Health and Innovation Conference, World's Largest, in New Haven in April

The Innovation Prize is a $10,000 and a $5,000 cash prize that is awarded to the two best social impact pitches that are presented at the 2017 Global Health & Innovation Conference, to be held in New Haven at Yale University on April 22-23, 2017. The Global Health & Innovation Conference (#GHIC) is the world's leading and largest global health conference as well as the largest social entrepreneurship conference, with 2,200 professionals and students from all 50 states and more than 55 countries, according to conference organizers.

The conference was developed by Unite for Site, a 501(c)(3) nonprofit global health delivery organization that is free of commercial interests and committed to promoting high-quality health care for all. GHIC 2017 will be Unite For Sight's 14th annual conference, having grown from a conference of about 100 participants in its first year.unite-for-sight-logo

Unite For Sight, headquartered on Church Street in New Haven, supports eye clinics worldwide by investing human and financial resources in their social ventures to eliminate patient barriers to eye care. Unite For Sight applies best practices in eye care, public health, volunteerism, and social entrepreneurship to achieve our goal of high-quality eye care for all. The programs are locally led and managed by ophthalmologists at Unite For Sight's partner eye clinics.

unite-2Unite For Sight's international eye care services with partner local eye clinics are provided year-round and are comprehensive, including examinations by local eye doctors, diagnosis and care for treatable conditions, education, and preventative care. The organization’s website indicates that Unite For Sight has provided eye care services to more than 2.1 million people worldwide, including more than 93,166 sight-restoring surgeries.

The conference is expected to include 300 speakers, including keynote addresses from:

  • Vanessa Kerry, Founder and CEO, Seed Global Health
  • Jeffrey Sachs, PhD, Director of Earth Institute, Columbia University; Quetelet Professor of Sustainable Development, Professor of Health Policy and Management, Columbia University; Special Advisor to Secretary-General of the United Nations Ban Ki-moon
  • Sonia Sachs, Director, Health Sector, Earth Institute, Columbia University; Health Coordinator, Millennium Village Project
  • Leana Wen, Baltimore City Health Commissioner

Unite for Sight was founded in 2000 by Jennifer Staple-Clark, then a sophomore at Yale University, in her dorm room. Unite For Sight is now a leader both in global health education and in providing cost-effective care to the world's poorest people. Staple-Clark, the organization’s Chief Executive Officer, is being honored in November by the Greater New Haven Chamber of Commerce as a Millennial Move Maker.unite

She is the recipient of the 2011 John F. Kennedy New Frontier Award, presented by the John F. Kennedy Library Foundation and the Institute of Politics at Harvard's Kennedy School of Government to "an individual whose contributions in the realm of community service, advocacy or grassroots activism have elevated the debate or changed the landscape with respect to a public issue or issues." In 2015, Middlebury College's Center for Social Entrepreneurship presented Jennifer with the Vision Award "to recognize leadership and vision in the world of social entrepreneurship."

Topics at the April conference will also include design thinking; education and school-based programs; environment health, energy, food and agriculture; healthcare delivery, university education initiatives; health policy, mental and neurological health; patient-centered initiatives; marketing communications; social entrepreneurship; surgery & global health; technology in global health; and non-communicable diseases.

unite-3The conference also includes Social Impact Labs, which provide an opportunity for selected speakers to present their new idea in the format of a 5-minute pitch. All of the presentations are ideas that are being developed, meaning that the ideas are in the brainstorming, early development, or early implementation stage.  Following each presenter’s 5-minute pitch, there is a 15-minute period for discussion and coaching with two expert speakers, questions, answers, and feedback from the audience.

For Innovation Prize at the 2017 GHIC, there are two categories: Early Stage (idea, program, or organization is less than 3 years old, and ideas in the brainstorming stage are also eligible) and Established Stage (program or organization is 3-6 years old). A newer program (0-6 years old) that is within an established (7+ year old) organization qualifies for the Social Impact Lab category as well.

https://youtu.be/Lt818tE5AUc

https://youtu.be/NtTtFAv-uTQ

Hate Words in School Setting Increasingly Target Race, Ethnicity and Sexual Orientation

It has been estimated that 160,000 teens nationwide skip school every day because of bullying.  Words of hate are a reason why. A recent report by the U.S. Department of Education indicates that among students ages 12 through 18 who reported being called a hate-related word at school, the percentage of students called a gender-based hate word decreased from 2001 to 2013, while the percentages of those students called race-, ethnically-, and sexual orientation-based hate words increased.

The report found that:

  • The percentage of students who were called hate words associated with race was greater in 2013 (50 percent), as compared to 2001 (34 percent).
  • The percentage of students who reported being called ethnically based hate words was greater in 2013 (29 percent), as compared to 2001 (22 percent).
  • The percentage of students who reported being called a hate word associated with sexual orientation was greater in 2013 (16 percent), as compared to 2001 (10 percent).
  • The percentage of students who were called gender-based hate words was lower in 2013 (15 percent), as compared to 2001 (23 percent).

hate-wordThe U.S. Department of Education July 2016 Data Point report from the National Center for Education Statistics includes data from the School Crime Supplement (SCS) to the National Crime Victimization Survey, a nationally representative sample survey of students ages 12 through 18, which were used to analyze trends in hate-related words. The SCS study is completed every other year.

In the study, students were asked if they had been called a hate-related word in the school building, on school property, on the school bus, or going to or from school, or if they had seen hate-related graffiti in school. Specifically, students were asked if during the school year anyone called them an insulting or bad name at school having to do with their race, religion, ethnic background or national origin, disability, gender, or sexual orientation (hate-related words). Students were also asked if they had seen any hate-related words or symbols (graffiti) written in school classrooms, school hallways, or outside of the school building.

The Southern Poverty Law Center (SPLC) has reported this year that “the gains made by years of anti-bullying work in schools have been rolled back in a few short months,” due to comments made as part of the Presidential campaign.  “Teachers report that students have been ‘emboldened’ to use slurs, engage in name-calling and make inflammatory statements toward each other,” explaining that “students have been emboldened by the divisive, often juvenile rhetoric in the campaign. Teachers have noted an increase in bullying, harassment and intimidation of students whose races, religions or nationalities have been the verbal targets of candidates on the campaign trail.”

The federal government’s stopbullying.gov website defines bullying actions to include “making threats, spreading rumors, attacking someone physically or verbally, and excluding someone from a group on purpose.”  The Bullying Prevention and Response Training and Continuing Education Online Program develschool-wordsoped by the federal Health Resources and Services Administration notes that “indirect bullying” includes “rumor spreading or encouraging others to exclude a peer.” Bullying is described as “a public health problem and requires a coordinated community response.”

“Harassing conduct may take many forms, including verbal acts and name‐calling” the U.S. Department of Education Office of Civil Rights pointed out in 2010 correspondence to the nation’s schools from Assistant Secretary of Civil Rights Russlynn Ali. The information provided pointed out that such behavior “fosters a climate of fear and disrespect that can seriously impair the physical and psychological health” of those subjected to it, and can “create conditions that negatively affect learning, thereby undermining the ability of students to achieve their full potential.”

The SPLC highlights the impact on students: “Every student, from preschoolers up through high school, is aware of the tone, rhetoric and catchphrases of this particular campaign season. Students are hearing conversations at home. They’re chatting, posting and joking on social media. Whether teachers decide to bring it into the classroom or not, kids are talking about it, modeling their behavior on that of political candidates and bringing heightened emotion to school along with their backpacks.”