Serious Health Issues Faced by State's Asian Pacific American Residents, New Study Reveals

Stereotypes about a thriving and problem-free Asian Pacific population in Connecticut are just plain wrong, according to a new statewide Needs Assessment Study which reveals “high rates of physical and mental health problems” and serious concerns about access to proper food and healthcare, often exacerbated by communication breakdowns  and language barriers." The 21-page study, by the Connecticut Asian Pacific American Affairs Commission, is said to be the first of its kind in Connecticut.  The 2010 U.S. Census reported APA’s as one of the fastest growing minority populations, growing from 2.4 percent of Connecticut’s population in 2000 to 4.4 percent by 2010. The Census projects a steady increase of the APA population through 2050.

The Needs Assessment was developed in collaboration with three community-based organizations: the Khmer Health Advocates, Lao Association of Connecticut aapacc_logo5-300x151nd Connecticut Coalition of Mutual Assistance Associations. The project was also supported by the Asian American Studies Institute at UConn, the UConn School of Pharmacy and the UConn School of Social Work. It focused on housing, education, language access, employment, access to public resources, and medical and mental health.

More than 300 Southeast Asian Connecticut residents – all over age 18 - participated in the study, include just over one hundred from each of three ethnic groups: Cambodian, Lao, and Vietnamese. The study found clear distinctions between the populations in Connecticut, and researchers stressed that viewing the Asian Pacific American (APA) population in the state as one block of people does a disservice to them, and does not adequately respond to their needs.

Food Insecurity

Food insecurity was a “prominent problem,” according to the report. “Close to half reported that they often or sometimes couldn’t afford to eat balanced meals and 43 percent indicated that their food supplies ran out The survey also reviewed “several measures of food insecurity” and found “significant association” between the ethnic groups and “finding it too expensive to have a balanced meal often or sometimes,” as well as “going hungry for lack of sufficient money for food.”

The report also indicated that “all of the ethnic groups reported concern that some members of their community were socially isolated. In particular, they reported that those age 50 and older were most at risk for isolation.”

capitolHealthcare Concerns

Regarding healthcare, “nearly half experienced at least some difficulty in getting the healthcare they believed they needed,” the report indicated. In addition, “more than half of all participants reported experiencing a language barrier with their physician, and for those that needed an interpreter, 59 percent indicated that a professional interpreter was never or rarely available for healthcare visits.”

In regards to Southeast Asian Refugees, the report noted "chronic mental and physical health conditions follwoing a history of severe trauma," adding that "it is vital that primary care physicians and others treating these individuals screen for a wide range of physical health conditions as well as PTSD and depression."  At a State Capitol news conference releasing the report, Dr. Megan Berthold, Assistant Professor in the UConn School of Social Work, said that there is an "urgent need" to address these concerns, adding that the lack of communication can be "dangerous" and could "lead to misdiagnosis."

Among those who received prescriptions, nearly one-third said they did not fill it due to the expense, and among all surveyed, 17 percent “did not see a doctor when they felt they need to” during the past year due to the high cost.

Among the ethnic differences, a greater number of Vietnamese are smokers, Cambodians were “significantly more likely to be diagnosed with PTSD and depression,” and the Lao community indicating the least frequency of language barriers with physicians. Overall, however, the report indicated that “these communities continue to be underserved due to the limited to no resources available to focus on the cultural and linguistic needs of their communities.”

Numerous Recommendations

Included in the recommendations, the study report states that “service providers, state agencies and stakeholders are encouraged to partner with APA communities” in multiple ways, and calls for additional research that “can advance the needs of the APA population.” The series of 14 recommendations include greater training anreportd education, promoting preventative care, actively recruiting APA members in various professional fields, creating diversity in the workforce, translating materials into the most common APA languages, and raising awareness among the APA population regarding their rights.

It is hoped that Needs Assessment studies can focus on other APA ethnic groups, such as the Indian and Chinese communities, in future years. The APA population in Connecticut includes approximately 50 ethnic groups, sharing some similarities and having great diversity. As the initial study demonstrated, specific needs may vary – an important fact for policy makers and those working with this fast-growing aspect of the state’s population.

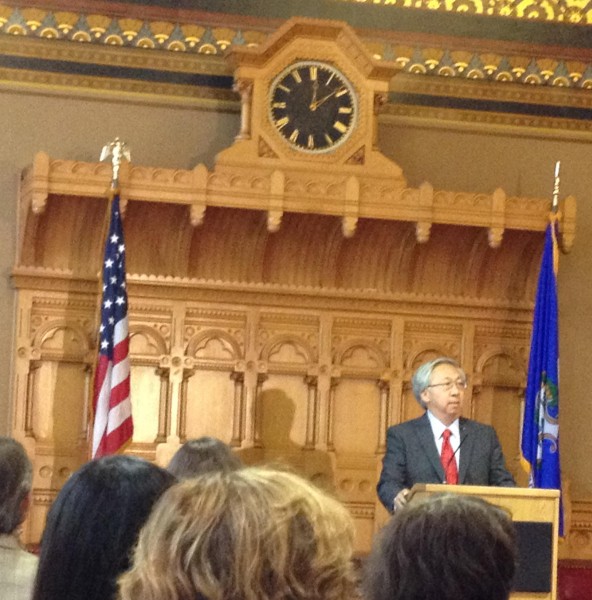
Among those commenting on the report during the news conference were Secretary of the State Denise Merrill, who was instrumental in the establishment of the Commission when she was House Majority Leader in the legislature, Marie Spivey, Chair of the State Commission on Health Equity, Tanya Hughes, Executive Director of the state's Commission on Human Rights and Opportunities, and Dr. William Howe, Chair of the Asian Pacific American Affairs Commission (see photo, at left). Theanvy Kuoch, Executive Directo of Khmer Health Advocates, noted that "working together we can improve outcomes for our community members while engaging them in their own care.  We have evidence that this approach also saves health care dollars."

The Asian Pacific American Affairs Commission was created in 2008 by an act of the Connecticut legislature.  The 21 member bipartisan commission oversees matters concerning hte Asian Pacific American population in Connecticut, and makes recommendations to the General Assembly and the Governor on the health, safety, education ,economic self-sufficiency and efforts to remain free of discrimination within the APA population in the state.

Woodstock is CT's Best Town for Teens, Analysis Shows

Last week, Connecticut by the Numbers reported that Connecticut’s under-18 population has declined during the past decade, and the state now ranks #37 in the nation in the percentage of residents less than 18 years-old. Now, the Hearst newspapers in Connecticut have researched the best towns for teens to live in the state. Topping the lwalkingist were the small towns of Woodstock, Cornwall, and Prospect. The Hearst analysis to determine the state’s best towns for teens, included five sets of numbers: the town’s four-year graduation rates for high schools; the percentage of the population between the ages of 15 and 19; the percentage of teens holding a job; teen pregnancy rates; and arrests numbers for teens charged with drug offenses and driving while intoxicated.

Here are Connecticut’s Top 10 Towns for Teens:

  1. Wood stock 84.3top towns
  2. Cornwall 82.5
  3. Prospect 82.0
  4. Mansfield 80.9
  5. Eastford 80.7
  6. Wolcott 80.6
  7. Brooklyn 80.2
  8. Scotland 80.0
  9. Bolton 79.9
  10. New Hartford 79.9

At the bottom of the list are the towns of Winchester (38.6), East Windsor (38.2) and Derby (19.3), the data indicates.  Not a single Southwestern Connecticut town cracked the top 10 of the list, according to the story published by Hearst Media. Newtown is the Southwestern Connecticut town with the highest score, coming in at No. 14, with a total score of 78.5 out of 100.

“Though idyllic towns dotting the landscape around Fairfield County and surrounding areas are often heralded as havens for raising children, many of the smaller, more affluent spots were ranked near the middle of the list or below: Ridgefield came in at No. 38 with a score of 74.6; New Canaan came in at No. 72 with 69.6 points; Darien was No. 81 with 68.4 points; Westport was No. 106 with 65.2 points; and Greenwich was No. 119 out of 169, with 62.3 points,” Hearts Media reported, in a story published by the Connecticut Post.

Connecticut’s Under-18 Population Ranks #37 in USA, Has Dropped During Past Decade

Where are the nation’s young people? Definitely not in New England, proportionally speaking. Nearly one-third of Utah’s residents - 31.3 percent - are under age 18, the highest percentage in the nation. In Connecticut, the under 18 population is just over one-fifth, at 22.4 percent, ranking the state at #37, and below the national average of 23.7 percent.

Connecticut, however, fares better than its New England neighbors in the percentage of population that is under age 18. The New Engalnd states of Rhode Island (20.8 percent), Maine (20.4 percent) and Vermont (20.1 percent) are ranked #48, #49, and #50 at the bottom of the list, with the smallest percentage of residents under age 18. Massachusetts ranked #44 and New Hampshire at #45.under_18_icon

Among the states with the highest percentage of their population under age 18, after Utah, are Texas at 27.1 percent, Idaho at 27 percent, Alaska at 26 percent and Georgia at 23.5 percent. The lowest percentage is in Washington, D.C. at 17.1 percent.

Connecticut’s percentage of residents under age 18 has dwindled during the past decade, from 24 percent in January 2004 to 23.6 in January 2008, to 22.4 in January 2012. Between May 2010 and May 2012 only Michigan, New Hampshire, Rhode Island and Vermont experienced a larger drop in the percentage of under 18 population.

New York (#42) and Pennsyunder 18lvania (#43) are also in the bottom ten. New Jersey has the highest percent of young people in the region, ranked at #30, with 23.2 percent.

Under 18 years old is defined as the percent of the total population under age 18. Data on age were collected as part of the American Community Survey (ACS) of the U.S. Census, a nationwide survey designed to provide communities with demographic, social, economic and housing data every year. It has an annual sample size of about 3 million addresses across the U.S. The data was reported by Bloomberg.com, using the latest ACS data through 2012, and was compliled in 2013.

New CT Law Responds to Sudden Cardiac Arrest in Student Athletes As Debate Continues

Research shows that an EKG exam, coupled with a complete medical history, and a thorough physical exam is the best way to prevent sudden cardiac arrest. That statement, on the home page of the organization “Screen Across America,” is followed by this statistic: Cardiac arrest is the #1 cause of death of student athletes.” Screen Across America is a consortium of organizations that provide heart screenings to students. They have a presence in 26 states; Connecticut is not one of them. The organization “believes that this should be a standard of care because thousands of children die every year from sudden cardiac arrest.” New York, New Jersey, Massachusetts and Vermont are among the states with local organizations advocating for screening. Connecticut does have a chapter in the Sudden Cardiac Arrest Association (SCAA). The Naugatuck-based chapter raises funds to place Automated External Defibrillators in Connecticut schools. screen_across_america_iisymptons

A recent article in the Wall Street Journal highlighted the divided opinion among the medical community, as well as athletics departments, athletes and parents. The publication reported that “whether to screen young athletes’ hearts – as is done in nations such as Italy and Israel – represents one of the hottest debates in American cardiology.”

The article noted that opponents and proponents of screening each have medical studies backing up their positions, and that proponents were encouraged recently when the National Institutes of Health and the Centers for Disease Control and Prevention announced they would be creating a registry for studying sudden death among those 24 and younger.

Hartford Hospital’s chief of cardiology, Dr. Paul Thompson, told the WSJ that when a young athlete dies from hypertrophic cardiomyopathy (HCM), “it probably could hve been detected. But when a screen finds it in a young athlete without symptoms, we don’t know that it ever would have caused him problems. Meanwhile, he gest labeled a cardiac cripple for life.” you

The Screen Across America consortium does not have a particular organizational model across all locations. Each locale operates “independently of each other,” the website points out, with some being nonprofits and others for profits. “Some of us charge for heart screenings while others offer it free of charge. Our screening protocols may differ slightly. However, many of us have adopted the Seattle Criteria – a set of guidelines made by international experts in the field of sports cardiology,” the website explains.

Another organization advocating screening is “Parent Heart Watch,” which was founded in 2005, as was SCAA. It was started by four parents who each saw their child die from sudden cardiac arrest (SCA). The organization’s website says that “research has shown that SCA is the leading cause of death on school property with one student athlete falling victim to SCA every three to four days. Heart disease is the second leading cause of disease-related fatalities in youth according to the Centers for Disease Control and Prevention (CDC).” The organization also provides information on timely, effective medical responses to cardiac arrest.

According to the American Academy of Pediatrics, SCA takes the lives of thousands of children every year. The United States Centers for Disease Control and Prevention estimates at least 2,000 such deaths occur annually, according to the website of the Sudden Cardiac Arrest Foundation. During the 2014 Connecticut legislative session, a proposal that became Public Act 14-93 earlier this month was approved, which will direct the State Board of Education, in conjunction with health experts, to develop a sudden cardiac arrest awareness program for use by local boards of education. The program must include information on:

  • SCA warning signs and symptoms, including fainting, difficulty breathing, chest pain, dizziness and abnormal racing heart rate
  • Risks of continued athletic activity after exhibiting SCA symptoms
  • Means of obtaining treatment for a suspected occurrence of SCA
  • Proper methods for returning students who experience SCA to athletics.

It will also require school coaches to:

  • Review the SCA awareness program each school year, beginning in 2015
  • Immediately remove students from play who show symptoms of SCA
  • Not permit students removed from play to return without the written clearance of a licensed healthcare professional.

billIn addition, it calls for creation of a consent form for parents of student athletes to sign on the warning signs, symptoms and treatment of SCA and relevant school policies. Similar legislation has already been adopted in Pennsylvania, several other states are also considering SCA bills, according to the SCAF. The provisions of the new law take effect a year from now, with the school year that begins in the fall of 2015.

Connecticut’s legislation was inspired in part by the tragic story of Andy Peña, a Darien student athlete who died of sudden cardiac arrest in 2011, just one month away from turning 15. Andy’s parents, Victor and Giovanna, founded the Andy Smiles Forever Foundation in his memory, to educate the general public and support research on the causes and prevention of sudden cardiac death amongst youth, officials said.

http://www.youtube.com/watch?feature=player_embedded&v=hiheVyvFQiA


Efforts to Connect Entrepreneurs Hit the Road Statewide

Some have suggested that the road back for Connecticut’s economy will be built one entrepreneur at a time. If that is the key to an economic rebound, an initiative by New Haven-based company Independent Software is looking to ramp up the process by gathering entrepreneurs in bunches. In fact, New Haven will be the next stop on eight-month Whiteboard Startup Roadshow tour across Connecticut, in the midst of the city’s celebrated International Festival of Arts and Ideas this week. Organizers indicate that cities like New Halogo whiteboardven are “overflowing with impossible ideas and the people who make them happen. We believe connecting to all three -- the place, the thinking, and the people -- can increase the probability of success for others who have impossible ideas.”

On Thursday June 26, from 2-5pm, The Whiteboard is bringing together New Haven area innovators and entrepreneurs for “a little history and to talk about the future.” The “Roadshow” stopped in Hartford last month, with a well-attended program at the reSET co-working space downtown.

Following the Arts and Ideas' "Innovation in the Ninth Square" walking tour of The Grove, SeeClickFix, and MakeHaven, individuals are asked to gather at Luck and Levity for an Open House and Entrepreneur Showcase beginning at 2 PM, followed at 4 PM by perspectives offered by:

  • Margaret Anne Tockarshewsky, New Haven Museum
  • Elon Boms, Launch Capital
  • Jim Gregory, Core Informatics

The Whiteboard - and the The Whiteboard Start-Up Roadshow – is operated by Independent Software, which runs from The Grove co-working space in New Haven, and is supported by CT Next.

Following a kickoff event in New Haven on April 1, the tour moved on to Stamford in April, then to Hartford in May, back to New Haven this week. In eight months’ time, organizers “expect to have a treasure trove of stories from each region and to see a larger, stronger, and more connected startup community state-wide.”  The list of cities to be visited for gatherings of local entrepreneurs is below.  whiteboard_logoheader1

Independent Software works with early-stage entrepreneurs “to develop the products, talent, and community they need to thrive.” The company also provides access to Connecticut’s vast startup community through The Whiteboard, which includes a diverse network of entrepreneurs, investors, and supporters.  The Whiteboard website outlines the Roadshow cities on the calendar:

  • July: Bridgeport-Fairfield: In the context of the city’s own summer arts festival, we’ll shine a light on the amazing progress Bridgeport’s entrepreneurial scene has made in recent years, working closely with the B:Hive, the Business Council of Fairfield County and others.
  • August: New London-Norwich: SECT Tech Center at Avery Point for bioscience startups and a robust arts scene makes the shoreline a unique place to start a business. Along with the New London-Groton area, Norwich is new territory for us so this area will be true exploration.
  • September: Storrs-Windham: From incubators to partnerships with UTC and others, UConn Storrs is a hub of activity for a myriad of innovation startups. Windham’s history, arts and social entrepreneurship adds to the mix for this not-so-quiet corner of the state.
  • October: Danbury-Waterbury: The Danbury Hacker Space is launching this year, and it’s just the beginning of activity for their entrepreneurs. As one of Connecticut’s many factory towns, Waterbury is looking to leverage its buildings to help launch small businesses.
  • November: Middletown-Meriden: As a connection point between the shore and Hartford, this area has pockets of innovation that you wouldn’t suspect. We hear rumblings of a startup culture and look forward to unearthing what’s here.
  • December: Torrington: Litchfield County is known for its organic farming and getaways. Yet, Torrington’s Warner Theater and energetic young politicians are fighting hard to be heard. We look forward to bringing these hidden gems to you.


CT Ranks #12 in Meeting Long-Term Care Needs of Older Residents

When it comes to support for seniors and caregivers, it matters where you live – and Connecticut is better than most places. According to a new, comprehensive state-by-state Scorecard from AARP, Connecticut ranks 12th in the nation in meeting the long-term care needs of older residents and people with disabilities. Even with the solid showing, AARP officials stress that more needs to be done, especially as the state’s 50-plus population continues to grow. Specific areas cited include more support and training for family caregivers, and easing patient transitions to and from the hospital or a skilled nursing facility.

senior long term careRaising Expectations 2014: A State Scorecard on Long-Term Services and Supports for Older Adults, People with Physical Disabilities, and Family Caregivers – an update of the inaugural 2011 Scorecard – ranks each state overall and within 26 performance indicators along five key dimensions:

  • affordability and access;
  • choice of setting and provider;
  • quality of life and quality of care;
  • support for family caregivers; and,
  • effective transitions.

New indicators this year include length of stay in nursing homes and use of anti-psychotic drugs by nursing homes, raising serious concerns about the quality of institutional care. The Scorecard was complied by AARP with support from The Commonwealth Fund and SCAN Foundation.

According to the state Scorecard, a majority of family caregivers (59.4%) face a degree of stress and worry. In addition, Connecticut ranks last (51) when it comes to the percent of home health patients with a hospital admission. This signifies a need for more resources and training for family caregivers - especially around compCT rankingslex medical tasks – so that their loved ones don’t end up back in the hospital and can continue to live independently at home, according to AARP officials.

“The vast majority of older Connecticut residents want to live independently, at home, as they age – most with the help of unpaid family caregivers,” says Nora Duncan, state director of AARP Connecticut, which serves nearly 600,000 members age 50 and older in Connecticut.

Today, unpaid family caregivers provide the bulk of care for older Connecticut residents, in part because the cost of long-term care remains unaffordable for most middle income families. In Connecticut, it is estimated that more than 486,000 residents help their aging parents, spouses and other loved ones stay at home by providing assistance with bathing and dressing, transportation, finances, complex medical tasks like wound care and injections, and more.

long term scorecard“When it comes to helping older Connecticut residents live in the setting of their choice, this silent army of family caregivers assumes the lion’s share of responsibility,” explains Duncan. “Many juggle full-time jobs with their caregiving duties; others provide 24/7 care for their loved ones. With every task they undertake, these family caregivers save the state money by keeping their loved ones out of costly nursing homes – most often paid for by Medicaid. They have earned some basic support.”

The top 12 states overall are Minnesota, Washington, Oregon, Colorado, Alaska, Hawaii, Vermont, Wisconsin, California, Maine, District of Columbia, and Connecticut, which make up the top quartile among the states. At the bottom of the rankings are Tennessee, Mississippi, Alabama and Kentucky.

According to the Scorecard, Connecticut ranks 29th in the percent of Medicaid long-term care dollars that support care provided at home and in the community – the care setting that most residents prefer. The Scorecard spotlights specific areas that call for improvement, including:

  • Percent of home health patients with a hospital admission;
  • Percent of nursing home residents with low care needs;
  • Percent of people with 90+ day nursing home stays successfully transitioning back to the community.
  • Family caregivers without much worry or stress, enough time, well-rested;

Of the 26 Scorecard indicators, 13 may be improved through state policy changes, which officials say points to the importance of AARP’s multi-state advocacy campaign, launched this year, to help older Americans live independently, at home, and the family caregivers that support them. “Even facing tight budgets following the Great Recession, Connecticut is making clear progress to help our older residents. However, this Scorecard shows we have more to do – and with a predicted ‘silver tsunami’ sweeping over our state in the next 20 years, the time to act is now.”

The full state Scorecard, along with an interactive map of state rankings and information, is available at www.longtermscorecard.org.

Nicknames Tomahawks, Redmen, Chiefs, Warriors Remain in CT High School Sports

The New Haven Register editorial page has called on Connecticut high schools to do what Washington’s NFL franchise has thus far refused to do. Get with the times. The Register reports that “at least 23 high school teams in the state have names associated with Native Americans that could be considered offensive, from the Derby and Torrington Red Raiders to the Nonnewaug Chiefs or the Killingly Redmen and Glastonbury Tomahawks. Names containing Indians or Warriors are also popular among the state’s high schools,” the paper indicated.glastonbury high tomahawks

“While these names may have initially been created with the thinking they were honoring Connecticut’s rich history, they are not only offensive, but keep us rooted in a culture of racism that has lingered for too long. And while a name change may temporarily disrupt the identity of the school and its sports teams, if done right, it can be successful and be used to the school’s advantage.”

The list of team nicktorrington tshirtnames that are of concern varies. Some consider “Indians” inappropriate, yet the Cleveland Indians of Major League Baseball (MLB) have received virtually none of the criticism that has been leveled at the NFL’s Washington franchise. MLB’s Atlanta Braves fans have long been known for doing the “tomahawk chop” at teams’ games, and the NFL’s Kansas City Chiefs are not seen as being as offensive as the franchise name used in D.C.

Northwest Catholic High School in West Hartford recently told WFSB-TV that the school’s teams no longer officially use the name “Indians,” but as of this week, the schools website continued to feature its parent booster club as the “Tomahawk Club.” At Glastonbury High School, the athletics teams are called the “Tomahawks.”wilton logo

There have been some changes among Connecticut’s high schools and colleges, as the Register indicates. “Quinnipiac University, for example, changed the names of its sports teams and mascot in 2002 from Braves to Bobcats. At the time the name change was announced, the school indicated that ‘the university community clearly recognized the difficulties of using a name that has the potential to misrepresent and denigrate an entire group of people. And, despite our clear intention to honor and remember the Native Americans once known as the Quinnipiaks, to do so only through athletics was founKillingly High Schoold to be no longer appropriate.’”

In addition, “Newtown changed its name from Indians to Nighthawks. Its old Indian chief mascot had previously been discarded. Hall High School in West Hartford voted in 2012 to change its logo and mascot, but kept its team name, the Warriors,” the Register reported.

Among the Connecticut high schools that have received some attention on local and national websites are those with Indians, Chiefs, Warriors, Raiders, Sachems, Tomahawks, Redmen, Red Raiders and Chieftans (see below).

Two years ago, the Hartford Courant reported that a national Native American rights organization, the Morning Star Institute, indicated that “two-thirds of Native American symbols in educational sports have been eliminated since 1970. Among the colleges that have changed nicknames are St. John's University in New York, from the "Redmen" to the "Red Storm," and Marquette in Wisconsin, from the "Warriors" to the "Golden Eagles."

The unofficial list of high school team nicknames that are receiving attention in the midst of the Washington NFL franchise controversy:

CT_townsCanton High School (Warriors), Conard (West Hartford) High School (Chieftans), Derby High School (Red Raiders),Enfield High School (Raiders), Farmington High School (Indians), Glastonbury High School (Tomahawks), Guilford High School (Indians), Hall (West Hartford) High School (Warriors), H.C. Wilcox Technical (Meriden) High School (Indians),Killingly High School (Redmen), Manchester Senior High School (Indians), Montville High School (Indians), Newington High School (Indians), Nonnewaug (Woodbury) High School (Chiefs), North Haven Senior High School (Indians), Northwest Catholic (West Hartford) High School (Indians), Norwich Regional Vocational Technical School (Warriors), RHAM Junior Senior High School (Sachems), Torrington High School (Red Raiders), Valley Regional (Deep River) High School (Warriors), Wamogo (Litchfield) Regional High School (Warriors), Watertown High School (Indians), Wilcox Technical (Meriden) High School (Indians), Wilton High School (Warriors), Windsor High School (Warriors), Windsor Locks High School (Raiders).

12 Connecticut School Districts Named "Best Communities for Music Education"

Twelve Connecticut school districts have been named as being among the nation’s Best Communities for Music Education (BCME). The National Association of Music Merchants (NAMM) Foundation recognized 376 school districts across the country for exemplary music education programs. These districts and schools “set the bar in offering students access to comprehensive music education.”

The Connecticut school districts earning the recognition are: Avon, Canton, Cheshire, Glastonbury, Greenwich, Newington, Newtown, Southington, Torrington, West Hartford, Weston and Westport. school music

The BCME program applauds the efforts of teachers, administrators, parents, students and community leaders working to assure that music education is part of the core curriculum. More than 2000 schools and school districts participated in this year’s survey, according to the Foundation.

Now in its 15th year, the BCMbest music logoE program evaluates schools and districts based on funding, staffing of highly qualified teachers, commitment to standards, and access to music instruction. The NAMM Foundation with the assistance of researchers at The Institute for Educational Research and Public Service of Lawrence, Kansas (an affiliate of the University of Kansas) evaluate participants on these factors. Designations are made to districts and schools that demonstrate an exceptionally high commitment and greater access to music education.

“These schools and districts make a strong commitment to music education in the core curriculum supporting its essential value to a well-rounded education for every child,” said Mary Luehrsen, NAMM Foundation executive director.

A study published in 2007 by Christopher Johnson, professor of music education and music therapy at the University of Kansas, revealed that students in elementary schools with superior music education programs scored around 22 percent higher in English and 20 percent higher in math scores on standardized tests, compared to schools with low-quality music programs, regardless of socioeconomic disparities among the schools or school districts. Johnson compares the concentration that music training requires to the focus needed to perform well on a standardized test, according to an article published by the Public Broadcasting System.

Nina Kraus, a neuroscientist at Northwestern University and an author of a recent study that was published in The Journal of Neuroscience in November 2013, looked at 44 healthy adults ages 55 to 76, measuring electrical activity in a region of the brain that processes sound. The New York Times reported that they found that participants who had four to 14 years of musical training had faster responses to speech sounds than participants without any training — even though no one in the first group had played an instrument for about 40 years. sheet music

The BCME program is described as one of the NAMM Foundation’s foremost efforts to bolster support for school-based music education programs “that must be available for all children. Providing music education for all students is something any community can accomplish if it has the collective will to do so, regardless of size or affluence,” the organization points out.

The NAMM Foundation is a non-profit supported in part by the National Association of Music Merchants and its 9,000 members around the world. The NAMM Foundation works to advance active participation in music making across the lifespan by supporting scientific research, philanthropic giving and public service programs.

The full list of school districts is available on the NAMM Foundation website.


239 Towns in Connecticut Vie to Win State's "Fan Favorite" Tourism Contest

If you’re looking for your town on the drop down menu at the state’s tourism site as part of the second annual “fan favorite” contest, don’t be surprised if the list seems longer than you’d expect. The list of “towns” includes each and every one of the state’s 169 municipalities - plus 70 additional geographic entities that really aren’t towns at all. Some are familiar, many are not – except perhaps for the people who live or near their boundaries. Either way, they’re not towns or cities. Which could make it interesting as the votes are tallied.

Might “Woodstock” and “South Woodstock” divide the Woodstock vote? Or “Redding” and “Redding Ridge” the Redding vote? And where is Central Village, Oneco, Pine Meadow, or Quaker Hill? All are included on the list of towns.

That’s not even mentioning the back-to-back listings for “Barkhamstead” and “Barkhamsted” – presumably one is a misspelling, not a distinct geographic entity.monitor

Although the site asks for individuals to “vote for the town,” there are 239 choices available. Of course, after identifying a “town,” respondents need to indicate which “revolutionary place in town” has earned their vote for “fan favorite.”  No suggestions are offered there - entrants are on their own.

Voting opened earlier this month and continues on the agency's Facebook page through July 25. The winners will receive advertising and public relations support from the tourism office, and will also be featured in the 2015 Connecticut Visitor's Guide.fan favorite

The state’s tourism Facebook pages urges visitors to “Vote now for your chance to win a getaway to Niantic! The ZIP and ZEN prize package includes a four-night stay at the Inn at Harbor Hill Marina, $100 gift card to Grace boutique and a free all-day pass to Niantic Bay Bicycles.” Visitors are also asked to share a photo, presumably for posting on the state’s tourism web pages.

And if you’re wondering when it was founded – the state, not the Facebook page – the date listed is January 9, 1788.

The state’s tourism website, www.ctvisit.com, also provides a link to the contest, as well as the state’s visitors guide and a range of “52 getaways” and travel details and special offers. One can even sign up to be a “Connecticut Ambassador.” That web form does not include a drop down menu of towns – one simply just types in your town, without any suggestions or prompting.

Credit Card Delinquency Rate Places Connecticut At #20 Among States, Better Than U.S. Average

The credit card delinquency rate among Connecticut residents puts the state in the middle of the pack, ranked at #20 nationally, but the percentage has more than doubled compared with 2000 and climbed since 2006, according to data compiled by the financial website bloomberg.com. The credit card delinquency rate among Connecticut residents is slightly better than the U.S. average, and slightly better than the median among the states. credit card rate

The lowest credit card delinquency rates are among residents of North Dakota at 7.4 percent, Alaska at 7.6 percent, Nebraska at 8.3 percent, Wisconsin at 8.6 percent, and South Dakota at 8.7 percent.

Connecticut’s delinquency rate of 11.2 percent falls between Colorado at 11.1 percent and North Carolina at 11.2 percent. At the other end of the spectrum are California (17.7 percent), Florida (20.8 percent) and Nevada (22.4 percent). The U.S. average is 11.7 percent.

Since the beginning of the century, the credit card delinquency rate among Connecticut residents has climbed – from 5.2 percent in January 2000, to 7.8 percent in January 2003, to 11.2 percent in January 2009, where it has remained.

The national comparison is based on 2013 data, and was compiled this year. Credit card debt delinquency is the percent of all credit cards that are delinquent more than 90 days, including revolving accounts for banks, bank card companies, national credit card companies, credit unions, and savings and loan associations, according to Bloomberg.ee6b669580c44f948af5696e4913356f

Among the other New England states, Massachusetts ranks #39, Rhode Island is #44, Vermont is #16 and New Hampshire is #26. In the tri-state region, New York is #43 and New Jersey is #28 in individual credit card delinquencies among state residents.

Data on delinquent debt balances were collected as part of the Federal Reserve Bank of New York Consumer Credit Panel, a quarterly national survey of all individuals with a Social Security number and a credit report (usually aged 19 and over). It draws from a nationally representative 5 percent random sample from a database of about 40 million individuals’ detailed Equifax credit reports. The data is updated annually by the Federal Reserve Bank of New York, according to Bloomberg.