Cigna Recognized for Cultural Competency Efforts

Health disparities directly and indirectly cost the U.S. economy $309 billion annually, and it is estimated that approximately 30% of direct medical costs for Blacks, Hispanics, and Asians are unnecessary costs resulting from health disparities, according to a paper prepared by Connecticut-based Cigna. Indirect costs, the paper points out, include lost work productivity and premature death. The paper, focusing on Cultural Competency in Health Care, is part of an initiative by Cigna that has been recognized with an "Innovation in Advancing Health Equity Award" by the National Business Group on Health, which honored the insurer for its ongoing commitment to promoting health equity and reducing health care disparities in the workplace and community.

"Health equity exists when all people, regardless of race, gender, socio-economic status, geographic location, or other societal constructs have the same access, opportunity, and resources to achieve their highest potential for health. It is our hope that these companies provide an example and encourage other employers to advance health equity," said Brian Marcotte, president and CEO of the National Business Group on Health.

Cigna was recognized for its nationwide program, America Says Ahh, to improve preventive care and encourage regular check-ups. A key feature of the campaign is the TV Doctors of America preventive care advocacy campaign featuring five famous TV doctors.  Among them is Alan Alda, best known for his role on M*A*S*H.  Alda will be on Hartford on Saturday evening at The Connecticut Forum.

“For Cigna's network doctors and clinicians, we created and delivered an in-depth cultural competency training with an emphasis on engaging Hispanic patients, and produced an external white paper on Cultural Competency in Health Care,” said Peggy Payne, a leader within Cigna's Health Equity Strategy area.

“The U.S. population is increasingly diverse. Cultural competency is essential to deliver health care services that meet the needs of each individual and improves overall health,” said Christina Stasiuk, D.O., National Medical Director for Health Equity at Cigna.

Racial and ethnic minorities currently make up about a third of the U.S. population, and are expected to become a majority by 2055, the paper points out, noting that:

  • Hispanics will continue to make up the largest portion of the minority population
  • The Asian population is expected to grow at the fastest rate between 2015 and 2055
  • The foreign-born population will increase at a higher rate than the native born population, accounting for approximately 20% of the U.S. population by 2060

As the U.S. becomes more diverse, it is likely that more individuals will have limited English proficiency or will not adhere to Western cultural norms, which may contribute to greater health disparities, the Cigna paper points out.

“Reducing health disparities is a business and social imperative. Minority populations will likely become an increasing share of providers’ patient panels, employers’ workforces, and health plans’ customers, requiring that all stakeholders seek ways to promote health equity to improve health and access, reduce costs, and improve experience,” the Cigna paper emphasizes, suggesting employers can take to build cultural competency and improve health outcomes for all their employees by:

  • Expanding their human resources leadership team to include experts in cultural competency and diversity
  • Instituting multicultural staff representatives to support onsite health services, such as health fairs and open enrollment
  • Seeking feedback from diverse groups of employees about their experiences as health care customers
  • Providing materials and benefits information that are culturally competent, e.g., culturally adapted or language-specific
  • Proactively gathering the demographic data of their workforce to measure and take action on health trends
  • Collaborating with their health plan to better engage employees in their health

Cigna indicates that the company has “ongoing efforts to help ensure that Cigna staff is culturally and linguistically competent.”

The National Business Group on Health is the nation's only non-profit organization devoted exclusively to representing large employers' perspective on national health policy issues and helping companies optimize business performance through health improvement, innovation and health care management.

https://youtu.be/foL9gfbfweY

PERSPECTIVE: Cheers to Farm Brewers and Tomorrow’s Homegrown Jobs

by Brett Broesder Connecticut’s craft brewery industry is growing, and if lawmakers pass legislation that paves the way for farm brewers to grow statewide, the Nutmeg State will be in a better position to win tomorrow’s good-paying craft beer jobs.

Our state is currently home to more than 50 craft breweries; Connecticut brewers alone are producing more than 3 million gallons annually. The economic impact of the craft beer industry on our state is nearly $569 million every year.

Although craft breweries seem to be popping up everywhere, there’s still a lot of room for growth. In fact, nationwide over 1,000 cities with populations of more than 10,000 people still do not have a craft brewery, confirming that there is still room for growth in the marketplace.

Connecticut lags behind its neighbors. For example, in Massachusetts, there are currently more than 80 craft breweries with an annual economic impact of more than $1.4 billion. On the other hand, the Empire State is home to over 200 craft breweries with an annual economic impact of $3 billion.

The Nutmeg State’s craft beer industry is still growing. There are more than 40 new craft breweries in the planning stages across the state. Not only are craft breweries growing across the state, they’re booming nationwide. In fact, three decades ago, there were less than 125 breweries nationwide. Today, there are more than 5,300, accounting for more than 424,000 jobs.

Across the country, craft brewers created almost 7,000 jobs in 2016, bringing the total amount of industry jobs to nearly 129,000. Craft brewers also saw a six percent year-over-year rise in volume, producing over 24.6 million gallons of beer. Also, the rate at which craft breweries are opening is much faster than that which they’re closing.

One reason for our neighboring states having a leg up on craft brewery growth is their incentivizing farm brewing. In 2012, the New York State Legislature passed – and the governor signed into law – a bill creating a farm brewery license.

Since the license became available in 2013, more than 130 farm brewers have been permitted, creating jobs and growing the state’s economy. In fact, since 2013, craft beer production in New York State has increased by more than 50 percent.

Now, Connecticut has an opportunity to start the process of catching up if the General Assembly passes, and the governor signs, a bill that would create a farm brewers permit. This legislation – An Act Establishing a Manufacturer Permit for Farm Brewers (HB 5928) – allows for the manufacture, storage, bottling, and wholesale distribution and sale of beer manufactured at any place or premises located on a farm.

The permit also allows permitees to sell their craft beer at a farmers market, and requires permittees to use a certain amount of hops, barley, and other fermentable grown or malted in the state. After fulfilling these requirements, and purchasing a $300 permit, farm breweries can then advertise their products as “Connecticut Craft Beers.”

With this bill, state lawmakers have a real opportunity to help strengthen both the craft brewery industry and agriculture. And when a farmer and a brewery partner up, they create jobs, keep farmers farming, and help small businesses grow and thrive.

Connecticut’s House of Representatives recently passed the farm brewers bill unanimously. It’s now up to the State Senate to pass it, and for the governor to sign it into law.

_______________________________________

Brett Broesder is Co-Founder and Vice President of the Campaign for Tomorrow’s Jobs, which focuses on growing Connecticut’s economy for present and future generations in three key policy areas:  workforce preparedness, business growth & innovation and fiscal sustainability.   


Disconnected Youth: Fewer in Connecticut Than Nationally; Disparities Reduced But Continue

Fewer young people across the country are disconnected from school and work today than were before the Great Recession, according to new national data. The 2015 youth disconnection rate, 12.3 percent, is below the 2008 rate of 12.6 and well below the 2010 youth disconnection peak, 14.7 percent. All of Connecticut’s five Congressional Districts show lower rates of disconnected youth than the national average.

That’s a 16 percent drop over five years translates to roughly 900,000 fewer young people cut off from pathways that lead to independent, rewarding adulthoods, according to data compiled by the Social Science Research Council.

The report, “Promising Gains, Persistent Gaps,” compares the degree of youth disconnectedness in Congressional Districts across the country.

Disconnected youth are teenagers and young adults between the ages of 16 and 24 who are neither in school nor working. Being detached from both the educational system and the labor market during the pivotal years of emerging adulthood can be dispiriting and damaging to a young person, and the effects of youth disconnection have been shown to follow individuals for the rest of their lives, resulting in lower incomes, higher unemployment rates, and negative physical and mental health outcomes. The harms accrue not only to young people themselves, but reverberate across time and place, making youth disconnection a national concern that must be addressed by society at large.

Youth disconnection rates vary enormously by congressional district—from an impressively low rate of 4.4 percent in Wisconsin District 2, the mostly urban Madison area, to an alarmingly high rate of 23.1 percent—or nearly one in every four young people—in Kentucky District 5 in rural Appalachia.

Connecticut fares relatively well.  Northeastern and Midwestern congressional districts have lowest rates of youth disconnection, 11.1 percent on average.

Connecticut’s best ranked Congressional district is the 2nd, in Eastern Connecticut, with an 8.7 percent of youth ages 16-24 disconnected, ranking 60th among the nation’s 435 Congressional districts.  Next best if Connecticut’s 5th district, in Western Connecticut, ranked 116th with 9.9 percent disconnected youth.  The 3rd C.D. ranks 134th, at 10.1 percent; the 4th C.D ranks 104th with 10.3 percent; and the 1st C.D. ranks 167th at 10.9 percent.

On average, a gap of 7.4 percentage points separates the best and worst districts within a state. Connecticut’s gap is only 2.2 percentage points.

The greatest disparity is found in New York State; a worrisome 15.2 percentage points separate New York’s District 20 in the Albany area (7.1 percent) and District 15 in New York City’s South Bronx (22.3 percent).

The most equitable state in terms of youth disconnection is also found in the Northeast; a nearly negligible 0.1 point separates Maine’s District 1, which hugs the southern coast and includes the capital, Augusta (9.8 percent), and District 2, a more rural district that encompasses most of the state (9.7 percent).

The analysis found that nationally, young women are slightly less likely to be disconnected than young men. And there is “astonishing variation in disconnection rates by race and ethnicity.” The share of young people cut off from workforce and educational opportunities, the report found, ranges from only one in fourteen Asian American youth to more than one in four Native American youth. The Asian American youth disconnection rate is 7.2 percent; the white rate is 10.1 percent; the Latino rate is 14.3 percent; the black rate is 18.9 percent; and the Native American rate is 25.4 percent.

The report concludes that “at-risk youth need the kind of support from communities and institutions that other young people take for granted: safe places to live and food on the table; caring adults to help them navigate the often-bewildering transition from child to adult; opportunities to try new things, to fail, and to try again; and experiences that build not just hard and soft skills for the marketplace, but also self-knowledge, agency, and confidence.”

Edible Arrangements, Subway Take Steps Forward and Back in Roller-Coaster Economy

Two of Connecticut’s leading food franchise success stories - Edible Arrangements and Subway – have both been in the news in recent days, seemingly moving in opposite directions.  Subway, for the first time in memory, is reducing the number of franchises across the country, while Edible Arrangements is in the midst of extending its brand, as its founder has taken back control of the equity in the business. Subway dropped 359 U.S. locations in 2016, the first time that Subway has had a net reduction. The store count dropped 1.3 percent to 26,744 from 27,103, but Subway remains the nation’s most ubiquitous eatery. (Behind only McDonald’s in sales.) Sales at Subway franchises fell 1.7 percent last year to about $11.3 billion, according to published reports. Subway is still growing internationally, with sales outside the U.S. increasing 3.7 percent to $5.8 billion last year, as the company continued to open locations.

Subway was founded about 52 years ago by Fred DeLuca and Peter Buck in Bridgeport. DeLuca died in 2015, leaving the company in the hands of his younger sister, Suzanne Greco, who became chief executive officer. The chain’s restaurants are entirely owned by franchisees.

Since its founding in 1999 in East Haven, Edible Arrangements has grown to more than 1,300 locations worldwide. Tariq Farid developed a "healthy obsession with fruit," and used his experience in the floral industry insight to develop a new business concept: fruit bouquets. Edible Arrangements began franchising in 2001, according to the company website.

Farid has completed a buyback of equity of the company which had been held by Greenwich private equity firm L Catterton.  The company has entered into a strategic partnership with L Catterton in June of 2012. Farid said the relationship provided assistance during a key growth phase for the brand, a time in which Edible Arrangements expanded into offering fresh fruit smoothies, froyo fruit blends, chocolates and more.

“The timing was right to take back full ownership so that I could be more fully engaged in building the future of the brand with our franchisees," Farid said, adding that "Edible Arrangements finds itself well-positioned for a future that includes exciting new opportunities for our franchises and the brand.”

Edible Arrangements has launched a system-wide conversion of traditional stores to a "whole-store" experience in the Edible To Go platform, featuring fresh fruit smoothies, froyo fruit blends and other fresh fruit treats. The company is coming off a year in which it registered a 27 percent increase over the previous year in both the number of new store openings and signings of new franchise agreements. It was named in Entrepreneur's Top 40 of "Fastest Growing Franchises" and "America's Top Global Franchises" as well as being included among the "Inc. 5000" list of the fastest growing privately-held companies.

"This is an exciting time to be a part of Edible Arrangements," Farid said. "At heart we are really a family of small businesses that have enjoyed incredible growth through a shared passion and willingness to work together towards common goals. Now we can focus all our energy on working together on the next evolution of the Edible Arrangements brand."

Edible Arrangements is headquartered in Wallingford; Subway is headquartered in Milford.

Some of Most Valuable Global Brands Are Connecticut-Based Businesses

Connecticut remains ranked among the top 10 states for corporate brands, according to a new study.  London-based Brand Finance has calculated Connecticut as being home to 20 of the 500 most valuable brands in the nation.  Connecticut ranked seventh. The state also was strongly represented among the 500 most valuable brands in the world, with a half-dozen earning a slot in the global rankings.

The Spectrum brand of Stamford-based Charter Communications is now the most valuable among Connecticut-based companies, at number 83 in the rankings of most valuable global brands, and number 43 among U.S. companies.

Health insurance giant Aetna, which has flirted with merger and departure in the past year but remains headquartered in Hartford, is number 166 on the list of most valuable global brands, moving up from number 188 on last year’s list.  Among U.S.-based brands, Aetna ranked at number 70.

Booking.com, part of The Priceline Group, came in at number 274 on the global rankings, down from number 201 a year ago.

Bloomfield-based CIGNA, which also had a merger thwarted in recent months, was ranked number 305, jumping more than 100 positions on the list, from number 439 last year.

ESPN, with world headquarters in Bristol, is at number 381 on the global list, down from 356 a year ago.

Norwalk-based Priceline was ranked number 386, down from 357 last year.  Xerox, also based in Norwalk, was just behind at number 389, up from number 396 a year ago.

Subway, which recently announced the closure of more than 300 U.S. restaurants in 2016, was ranked number 464 on the list, down from number 417 in the previous annual ranking.

The top ranked global brands were Google, Apple (which switched places from a year ago), Amazon.com, AT&T, Microsoft, Verizon, Walmart, Facebook, Wells Fargo, McDonalds, IBM and Boston-based GE. Six years after it last held the title in 2011, Google is now the world’s most valuable brand with a value of US $109 billion, according to Brand Finance.

NBC, which is not headquartered in Connecticut but has operations in Stamford, was ranked number 93 on the list of the top global brands.  Xfinity, also part of the Philadelphia-based Comcast corporate family, is ranked number 37.

Also earning a spot on the U.S.-based top 500 list are Sheraton (part of Stamford-based Starwood), Carrier (United Technologies), Frontier, United Technologies, Otis (United Technologies), The Hartford, Pratt & Whitney, Praxair, Harman International, and Pitney Bowes.

On the industry-specific list of the most valuable global toy brands, topping the list is Lego.  The company, based in Denmark, has operations in Connecticut.  Lego was also named the world’s most powerful brand, along with google, Nike, VISA, Disney, NBC, PWC, Johnson & Johnson and McKinsey & Company. Lego scores highly on a wide variety of metrics including familiarity, loyalty, promotion, marketing investment, staff satisfaction and corporate reputation.

Financial accounting and reporting standards requires a clear definition of what intellectual property is included in the definition of ‘brand’, Brand Finance points out.  The website defines brand as the “Trademark and associated IP including the word mark and trademark iconography”.

Most Valuable Brands of Connecticut Based Companies (Ranking on list of US Companies) – Spectrum (43), Aetna (70), Booking.com (108), CIGNA (126), ESPN (162), priceline.com (164), Xerox (166), Sheraton (189), Subway (196), Carrier (203), Frontier (208), United Technologies (232), Otis (292), The Hartford (332), Pratt & Whitney (340), Praxair (351), Harman International (372), Pitney Bowes (471), and United Rentals (475).

CT's Economic Performance Ranks 49th in US; Economic Outlook Ranks 46th

Connecticut ranks 49th in economic performance during the past decade and the state’s economic outlook ranks 46th among the nation’s 50 states in the latest “Rich States, Poor States” analysis by the American Legislative Exchange Council. The look-back at the decade 2005-2015 shows Connecticut ranking near the bottom in the three components that make up the ALEC-Laffer State Economic Competitiveness Index performance numbers.  The state ranked 47th in state gross domestic product and 44th in non-farm payroll employment, both below the national average, and 43rd in absolute domestic migration, which increased for the third consecutive year.

Connecticut’s overall economic outlook ranking, 49th in the nation, represents a drop from 47th in each of the past two years, and 44th and 34rd in the two previous years.  Back in 20120, Connecticut ranked 36th.  The economic outlook includes more than a dozen categories.  Among them, Connecticut ranks highest in sales tax burden (12th), remaining tax burden (16th), and debt service as a share of tax revenue (20th).

“Each of these factors is influenced directly by state lawmakers through the legislative process,” the report points out. The policy variables “have a proven impact on the migration of capital—both investment and human—into and out of states.”

In the 10th annual edition of the competitive outlook index, the lead states in the ranking are Utah, Indiana, North Carolina, North Dakota, Tennessee, Florida, Wyoming, Arizona, Texas and Idaho.  The highest ranking New England states are New Hampshire (number 18) and Massachusetts (number 25).  Joining Connecticut towards the bottom of the list are Rhode Island (number 36) and Vermont (number 49).

The Economic Performance Rankings (2005-2015) placed Texas, North Dakota and Washington State atop the list, followed by Utah, Colorado, Oklahoma, Oregon, South Dakota, North Carolina, and Montana.  Massachusetts was the highest ranked New England state, at number 18.

“Generally speaking,” the report indicated, “states that spend less—especially on income transfer programs, and states that tax less—particularly on productive activities such as working or investing—experience higher growth rates than states that tax and spend more.”

$93 Million in Tax Credits to Film, Digital Industries in Connecticut

An estimated $349 million was spent in Connecticut by qualified productions and $93 million in tax credits were issued to 25 media production companies under the state’s tax credit program during fiscal year 2016.  The tax credits are designed to boost the state’s economy by attracting film and digital productions to the state, creating employment opportunities for state residents. According to the Office of Film, Television and Digital Media, which supports and enhances Connecticut’s film, television and digital media industry, companies are provided with direct financial assistance programs, including but not limited to loans, grants, and job expansion tax credits structured to incentivize relocation to Connecticut and the growth and development of current Connecticut-based companies.

The breakdown by industry segment:

  • Production Companies - $188 million spent; $56 million in tax credits issued
  • Film Infrastructure - $106 million spent, $21 million in tax credits
  • Digital Animation - $54 million spent; $15 million in tax credits

Film infrastructure tax credits went to companies including ESPN in Bristol and NBC Universal in Stamford; Digital Animation tax credits to Blue Sky Studios in Greenwich.

The production companies receiving tax credits from the state included well-known names such as A&E, Connecticut Public Broadcasting, ESPN, World Wrestling Entertainment and Bob’s Discount Furniture, which received just under a million dollars in tax credits under the program.

The legislation, first approved in 2006 and amended twice during the past decade, makes it possible for eligible production companies to receive a tax credit on a sliding scale of up to 30 percent on qualified digital media and motion picture production, pre-production and post production expenses incurred in the state. The Office “actively assists local, national and international motion picture, TV and media production entities with finding locations in Connecticut, rules and procedures, securing permits, hiring local cast and crew and other services,” according to the agency’s website.  In addition, the Office “represents the state and its agencies, municipalities and resident media professionals in interactions with media production entities and the industry at large.”

The popular reality courtroom drama “The People’s Court” announced this month plans to move to a new location on Stamford’s West Side. The show’s production company, Ralph Edwards/Stu Billett Productions, is moving its headquarters to an 18,739-square-foot space at 470 West Ave., from its current space at 300 Stillwater Avenue in the city. Ralph Edwards/Stu Billett Productions received nearly $4 million in tax credits in fiscal year 2016, spending just over $13 million in the state on a number of prominent program productions.

This summer, a digital training program will provide courses at the UConn Stamford Campus including social media management, web design and development, and manipulating digital content.  Digital Media CT (DMCT) is developed in partnership by the Connecticut Office of Film, Television & Digital Media and the University of Connecticut Digital Media & Design Department. It has been designed for individuals who want to develop the basic skills necessary to seek work in the industry or enhance their current skill set and advance their careers.

The program is described as most appropriate for individuals with prior or current professional experience in the industry, college graduates with majors in communications, film, television, marketing, and digital media, or students currently enrolled in relative academic coursework.

Later this year from Blue Sky:

https://youtu.be/jyJgGsZo2wA

PERSPECTIVE: Wildlife Watching, Not Hunting, Is Better Choice for State Residents and Economy

by Annie Hornish Proponents of HB 5499, expansion of Sunday hunting to include guns on private land, argue that this bill will reduce deer populations, but this is not true.

Deer will produce more fawns and breed at an earlier age after their numbers are reduced. The same pattern repeats: deer are killed by archers in the fall, yet their numbers bounce back by summer.

When doing the math, it is easy to see why HB 5499 won’t reduce the deer population. According to deer harvest figures provided by Connecticut’s Department of Energy and Environmental Protection (DEEP), from September 15, 2016 through January 17, 2017 (latest available), Connecticut archers removed 5,088 deer from private land, and 3,729 deer were killed by shotgun/rifle and muzzleloader.

We can assume that a similar number of deer would be killed on a Sunday as on a Saturday with the additional forms of hunting (i.e., shotgun/rifle and muzzleloader). The latest figures for Saturday volume were 1,218 (shotgun/rifle (961) + muzzleloader (257) (2014)). Assuming this number is similar for the 2016-17 deer hunting season, passage of HB 5499 would therefore remove another 1,218 deer.

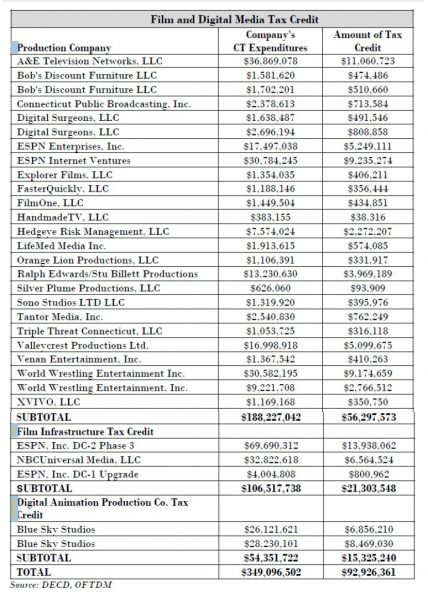
The last statewide deer population estimate, which was done in 2006, yielded 124,000 deer. If we assume that the deer population has remained the same for the past 8 years, a liberal estimate of this additional “take” would be less than 1% of the deer population. If we assume that the population is higher now than it was 8 years ago (this is the widely-held assumption from proponents of this bill, including DEEP), the additional “take” would drop below 1%.

Factoring in the additional number of deer taken by archers on private land under special landowner hunting provisions allowed per DEEP, the grand total number of deer killed still amounts to only 1% of the deer population or significantly less, depending on the current size of the deer population, and removing an additional 1% of the deer population will not, even in the immediate short term, significantly reduce deer numbers in Connecticut.

Like with deer, trapping of coyotes does not decrease the population, and may make the problem worse. One study found that even when up to 70% of their numbers are removed, coyote populations bounce back quickly. This is because a stable pack has only one alpha pair, and they are the only ones who reproduce. When one or both members of that alpha pair is killed, other pairs form and reproduce (breeding at earlier ages and having larger litters). Also, unstable packs can attract transient coyotes. The solution to conflicts with coyotes is public education on removal of attractants (e.g., accessible garbage, pet food left outside), and hazing to curb undesired coyote behavior.)

Deer problem management programs that focus on site-specific solutions offer successful, long-term solutions to conflicts with deer (e.g., a Michigan-based “Don’t Veer for Deer” program reduced deer-car collisions 25% despite a 34% increase in herd size; PZP immunocontraception programs; public education on deer resistant plantings). These solutions are not only sustainable solutions, but humane solutions.

Per the latest survey by the U.S. Department of the Interior, Fish and Wildlife Service and U.S. Department of Commerce, wildlife watchers (defined as observing, feeding, or photographing wildlife) in Connecticut not only outnumber hunters by a margin of 29 to 1, but they also outspend hunters by 7.4 to 1, contributing about $510 million to the economy annually.

Further, the survey also shows the following 10-year trends for Connecticut: a 42% increase in the number of wildlife watchers (from 774,000 to 1,102,000), and a 39% decrease in the number of hunters (from 62,000 to 38,000).

Connecticut should be forging policies that cater to wildlife watchers instead of pouring limited tax dollars into programs catering to a diminishing number of hunters.

___________________________________

Annie Hornish is Connecticut State Director of The Humane Society of the United States.

Safest States for Driving? CT Ranks #8 in USA

Connecticut is the eighth safest state in the nation for drivers, according to a new analysis of driving safety across the country. The report was derived from analyzing fatality data from the National Highway Traffic Safety Administration (NHTSA) and correlating the data with speeding, distracted driving and drunk driving statistics. Analysts for Safewise, a home security company that studies a variety of public safety issues, compiled the report, which found:

  • The majority of Connecticut's road fatalities come from drunk driving, however, Connecticut is among the top 10 states for fewest speeding fatalities.
  • Connecticut is among the nation's slowest average speed limits. SafeWise analysts found that slower speed limits lead to fewer fatalities, which explains why Connecticut is among the safest states.
  • Connecticut bans all forms of cell phone use, however, the state is among the worst for distracted drivers.

The safest states, according to the survey, are Delaware, Illinois, Kentucky, New York, Ohio, Louisiana, Massachusetts, Connecticut, Utah and West Virginia.

The report revealed that the safest states for driving typically have lower speed limits and less restrictions on phone use. The states that have longer commute times and slower speed limits have less fatalities. More dangerous roadways tend to be long interstates with speed limits in the 70’s and 80’s. States with younger median ages and higher birth rates correlated with higher fatality rates.  Inexperienced drivers and large families alike seem to be more distracted when on the road.

“Over the past few years, fatal crash statistics have increased substantially,” said Robert Dillman, owner and lead instructor of the Georgia-based NEVO Driving Academy. “According to data released by the National Safety Council, in 2016, the United States reached a 10 year peak in crash related fatalities. With regards to traffic and driver safety, from 2013 to present, we are trending in the wrong direction.”


Home Ownership in CT: Not Best, But Not Worst

When it comes to home ownership, Connecticut is in the middle of the pack among the nation’s 50 states.  A new report ranks the state at number 30, in the lower echelons of the states.  And when the report, by financial website ValuePenguin, identified optimal factors when considering homeownership, Connecticut faired more poorly in some key factors. Connecticut ranked 48th in affordability, followed only by California (49) and Florida (50).  New Jersey and Massachusetts were just ahead of Connecticut.  The best states for affordability were South Dakota, Wyoming and Idaho.

Ten factors, organized into three key categories were used to measure and rank the states. The three key categories of focus were: Housing Market Strength, Residual Costs, and Living Factors.

Factors that weakened a state’s position included propensity for crime, weak housing markets, and heavy burdens of costs to maintain a home – for instance the likelihood of property damage caused by storms and other calamities. Attributes that strengthened a state’s position included homeownership affordability, low mortgage rates, and low risk of calamities.

The 10 worst states to be a homeowner, according to the report, are Louisiana, Mississippi, Tennessee, New Mexico, and Alabama.  The best states, according to the analysis, are Iowa, South Dakota, Wyoming, Nebraska, Maine and Minnesota.

In terms of livability, the top states in the nation are the New England states of New Hampshire, Maine, and Vermont.