“Hometown” Banks Continue to Locate Away From Home

Apparently hometown pride and banking are mutually exclusive – or at least travel well.  The volume of banks bearing a community’s name that are opening branches far, far away from home continues to grow, which suggests that banks have clear and convincing evidence that the distant moniker just isn’t an issue for consumers.

The latest: Vernon-based Rockville Bank is asking state approval to open a Hamden branch, its first retail incursion into New Haven County, the Hartford Business Journal hasbank-vault reported.  The bank is planning to establish a 2,000-square-foot, full-service retail branch near the commercial- and residential-loan production office the bank opened in July 2011.  Earlier this year Rockville Bank crossed the Connecticut River to open a high profile branch in thriving West Hartford Center.

Connecticut by the Numbers has previously reported on the increasing number of banks with the name of a Connecticut town within the bank’s name that have opened branches – and many of them – in other towns.  An increasing number are opening in towns far afield, and last month, Massachusetts-based Westfield Bank opened a branch in Granby, CT.

Already, the list of town names doing double-duty as bank names is lengthy, with the institutions numbering two dozen:  Fairfield, New Canaan, Groton, Darien, Essex, Farmington, Greenwich, Suffield, Guilford, Jewett City, Litchfield, Milford, Naugatuck, Putnam, Rockville, Salisbury, Danbury, Simsbury, Stafford, Thomaston, Torrington, Wilton and Windsor.  And those are only the Connecticut towns, of course.

Among the town-line-jumping trendsetters:  Farmington Bank in South Windsor, Essex Savings Bank in Madison,  Jewett City Savings Bank (“your hometown bank”) in Brooklyn, Simsbury Bank in Bloomfield, and the Savings Bank of Danbury in Waterbury.  There are many more.

Although there are 25 out-of-state banks connecticutwith a presence in Connecticut, only Rhode Island-based Newport Federal Savings Bank, with an office in Stonington, included the name of a town – until the arrival of Westfield Bank.  Other well-known names, evoking out-of-state regions, include Bank of New York, Berkshire Bank (which is now in the process of purchasing 20 Bank of America branches in New York State), First Niagra Bank, and Hudson Valley Bank.

To look back at the CT by the Numbers hometown bank story, click here:

http://ctbythenumbers.info/2013/04/17/hometown-names-go-beyond-hometown-for-connecticut-banks/

To review the list of banking institutions in Connecticut, see the state Department of Banking list:

http://www.ct.gov/dob/cwp/view.asp?a=2228&q=296954

Little, Robustelli, Strong: Connecticut's Triple-Threat in NFL's Hall of Fame

Three members of professional football's Hall of Fame roster began their illustrious careers in Connecticut.  Floyd Little, inducted in 2010, and subsequently honored by his hometown of New Haven, is among 280 gridiron stand-outs included in a new interactive internet feature that allows fans to see where  inductees in the Pro Football Hall of Fame are from, and learn the highlights of their careers.

The interactive map was developed by Esri, a technology company in the state of Washington that “inspirnfl-hall-of-famees and enables people to positively impact the future through a deeper, geographic understanding of the changing world around them.”

Inducted in 2010, New Haven native Floyd Little’s multidimensional talents quickly translated into success at the pro level. As a rookie he led the American Football League in punt returns with a 16.9 average on 16 returns. Little also returned a career-high 35 kickoffs for 942 yards. His combined rushing and receiving yardage total that first season was just shy of 400 yards.

In 1971, he became the first 1,000-yard rusher in Denver Broncos history. He won the NFL rushing title that year as he finished with 1,133 yards on 284 carries and scored 6 touchdowns. Little was named to two AFL All-Star Games and three AFC-NFC Pro Bowls. He was also named All-AFL/NFL twice and All-AFC first- or second-team four straight years.

In all, Little amassed more than 12,000 all-purpose yards and scored 54 touchdowns during his career that spanned from 1967 to 1975. He gained 6,323 floyd little athletic centeryards on 1,641 career carries and scored 43 touchdowns. He added 215 receptions for 2,418 yards and 9 TDs. Little totaled 893 yards on 81 career punt returns and a pair of scores; and returned 104 kickoffs for 2,523 yards in his nine-season career.

The New Haven Athletic Center was officially renamed the Floyd Little Athletic Center in an impressive, two-hofloyd littleur ceremony in October 2011 that attracted some 200 people. A trophy showcase featuring uniforms, helmets and pictures from Little’s playing days at Hillhouse, Syracuse, Bordentown Military Institute and with the Broncos was unveiled, along with a wall plaque and, of course, the building’s new name.

“The Hall of Fame is one thing,” Little told the New Haven Register. “But having your name on a building is something different. It’s a great joy to have. No one could ever believe that a guy who came from this area, with very little means, could rise up to be an all-city, all-state, all-American, all-pro, College Football Hall of Fame and Pro Football Hall of Fame. It’s an unbelievable story, but I feel that I’ve been truly blessed.”

In addition to Little, Connecticut residents to reach the NFL and the Canton, Ohio Hall of Fame  are Ken Strong, who played in the 1930s and Andy Robustelli, a league standout during the 1950’s.

Halfback Ken Strong's most publicized performance in 14 years of pro football came in the 1934 National Football League Championship Game. In that now historic game, Strong contributed 17 points on two touchdowns, two extra points and a field goal to lead his New York Giants to a 30-13 victory over the Chicago Bears. He was born in 1906 in West Haven and died in 1979 at age 73.

The Los Angeles Rams drafted Andy Robustelli, an end from tiny Arnold College, in the nineteenth round of the 1951 National Football League draft. A long shot to make the team as an offensive end since the Rams already had such stars as Tom Fears and Elroy "Crazylegs" Hirsch, Robustelli responded in the only way he knew how - to go all out to make good at what was available to him, the defensive unit.

He went on to become one of the finest defensive ends in pro football history, playing five years with the Rams and then nine years with the New York Giants. He was a regular for the Rams’ 1951 championship team, and the one game he missed that season was the only one he missed in 14 NFL seasons.  He is credited with molding together the 1956 Giants team that won the NFL championship.

He was named All-Pro seven times and was named to the Pro Bowl seven times. In 1962 the Maxwell Club selected Robustelli as the NFL’s outstanding player, an honor that up until then was generally reserved for an offensive player. The honor was indicative of the high regard that fans, teammates and opponents all held for the future Hall of Fame defensive end.  A Stamford native born in 1925, Robustelli died in 2011 at age 85.

esri

Connecticut's Green Report Card: Needs Improvement

Connecticut’s state government received mixed grades in the new edition of the Connecticut Green Guide, published by Hartford Business Journal.  The publication reviewed state policy in our areas – microgrids, gasoline taxes, wind turbines and greenhouse gas reduction efforts – and graded the state’s efforts.

Connecticut received an “A” for recently announcing an $18 million grant program with nine microgrid projects in eight Connecticut communities, “adding protection from power outages and moving away from a centralized electriciMalloy aParkvillety system.”  Just a week ago, Gov. Malloy was joined by the White House Chair of the Council on Environmental Quality to highlight one of the state’s microgrid sites, in the Parkville neighborhood of Hartford.

The state received an “F” because of a moratorium on wind turbines, which has been in place since 2001, according to the Green Guide.  “Because of poorly written legislation and prolonged bureaucracy,” the publication explained, several projects have been delayed.  Another poor grade, a D+, was assigned because state taxes on gasoline rose 4 cents on July 1, “giving Connecticut the third highest taxes on motor vehicle fuel in the country.”  The publication noted that while “higher prices might egreen guilde logoncourage conservation, very little of the tax revenue goes toward fixing the aging transportation system, leading to vehicle inefficiencies and congestion.”

Connecticut fared better. earning a B+, in the analysis of the state’s participation in the Regional Greenhouse Gas Initiative, along with the other eight states in the region, which will “further lower the cap on power plant pollution,” which should, according to the publica50 statestion’s review, “make the air cleaner, and the proceeds will aid the clean energy industry.”

The publication also noted that Connecticut became the first state in the country to mandate mattress recycling, with a new law approved by the legislature this year, also adding a new paint recycling requirement to existing laws that call for recycling of electronic waste and mercury thermostats.  The state’s move toward a greater emphasis on “product stewardship,” is characterized by an increasing obligation imposed on consumers to recycle designated products, which helps the environment and provides business opportunities in the recycling of those products.

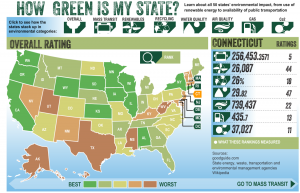
In a report on the green initiatives across all 50 states, published by Forbes magazine in July, Connecticut excelled in the areas of mass transit, ranking 5th among the states, in CO2 controls, ranking 11th, and recycling, ranking 18th.  The state was 44th in use of renewables and 47th in water quality.  That's according to this recent green ranking of states from MPHOline.org, a website that provides information on a variety of public health topics.

Data from the green product rating site GoodGuide was used to assess air and water quality, information from Wikipedia was the basis of the comparison on the number of mass transit systems in each state, and state agencies were used to provide information on the other categories.

CT Worst in Nation for Unemployed, Near Bottom in GDP Growth - But Not Miserable

Connecticut is the worst state in the nation for the unemployed, according to data compiled by Bloomberg news.  The state ranked last among the 50 states and District of Columbia on the difficulty of life for the unemployed based on three equally weighted criteria: income replacement, the unemployment pool and income disparity, based on data compiled from U.S. Bureau of Economic Analysis, U.S. Bureau of Labor Statistics, and U.S. Census.

According tbea_logo_460o the business news service, the ten most challenging states for unemployed residents are Connecticut, New Jersey, District of Columbia, California, Maryland, Alaska, New York, Virginia, Delaware, Massachusetts and New Hampshire.

The best states – at the opposite end of the data compilation – are North Dakota, Utah, Iowa, New Mexico, Oklahoma, Arkansas, West Virginia, Montana and Idaho.economic-indicators2

In developing the rankings, Bloomberg used the following:  Average weekly unemployment benefits was the quarterly average from 2Q 2012 to 1Q 2013. Personal Income per capita was calculated by dividing 2013 preliminary total personal income by state data from the Bureau of Economic Analysis by the state population from the Census as of mid-year 2012. Unemployment rates were the July 2012 to June 2013 seasonally adjusted 12-month average figures for the civilian non-institutional population. Household income ratios were from the U.S. Census Bureau, 2011.  The three scores were averaged for the final ranking.

Connecticut also ranked third from the bottom on Gross Domestic Product growth between 2008 and 2012, according to a companion Bloomberg report of data from the U.S. Bureau of Economic Analysis.  Only Arizona and Nevada had a worse track-record during the period.  Connecticut was one of ten states to experience negative GDP growth during the years of the comparison.  The state’s GDP dropped to 197.2 billion last year, from 202.5 billion in 2008.  The most dramatic increase in GDP was in North Dakota, where GDP grew 35 percent.  Next was Texas, with a 12 percent increase, followed by Oregon, West Virginia, Alaska, Louisiana, Utah, Nebraska, Maryland and Indiana.

There was some good news for the Land of Steady Habits in recent data.  Connecticut ranked #13 among the "least miserable" states in the nation.  Which are the most miserable states?  Louisiana, Mississippi, Arkansas, West Virginia, New Mexico, SoutCT welcomes youh Carolina, Alabama, Nevada, Tennessee and Kentucky.  All of which seems to indicate that a state can have solid GDP growth and still be relatively miserable - particularly for the unemployed.

Thirteen variables from the United Health Foundation's America's Health Rankings were isolated to determine each state's Misery Score. Among them:  Air pollution levels refer to micrograms of fine particles per cubic meter. High school graduation rates refer to percent of incoming ninth graders who graduate within four years. Poor health days refer to the number of days in which a person could not perform work or household tasks due to poor mental or physical health. Personal income refers to income from all sources and is not inflation adjusted.

The least miserable states were – from the top - Minnesota, North Dakota, New Hampshire, Vermont, Massachusetts, Hawaii, Iowa, Nebraska, Utah, Wisconsin, Wyoming, South Dakota – and then Connecticut, at lucky #13.

State Lottery Shows Strength in Connecticut, Land of Steady Habits

What would you do if you won the lottery?  According to a new survey, you’d go to work.  That's true not only in the Land of Steady Habits, but nationwide.

Two-thirds of American workers say they would continue working even if they won $10 million in the lottery, while 31% say they would stop, according to a new Gallup poll, released earlier this month. The desire to keep working after enjoying a financial windfall is higher today than in three earlier Gallup measures, all prior to the 2008-2009 recession, the polling firm reported.

Additionally, most American workers who predict they would continue working even after winning the lottery say they would want to stay at the same job rgallup pollather than seek a new job. The roughly 2-to-1 ratio in favor of keeping the same job versus getting a new one is about the same as in 2004, but slightly higher than in 2005 and 1997.

Bloomberg News has reported that lottery players in the U.S. spend an average of $396 a year purchasing lottery tickets, with residents of Massachusetts, Georgia and New York leading the way.  Using data from this analysis, Bloomberg identified which states see the highest and lowest payout ratios. Connecticut tops  neither list. On average, Massachusetts players spend $861, Georgians spend $471 and New Yorkers spend $450 on lottery tickets.  At the bottom in per person spending, on average, are Oklahoma ($71), Montana ($61) and North Dakota ($47).

In fiscal year 2012, players in Connecticut won $659.9 million in prize money. At the same time the CT Lottery provided a record $310 million to support the services and programs founded by the state’s General Fund including public health, libraries, public safety, education and more, according to state lottery officials. Connecticut’s first lottery btop 3egan in 1972, and was the fourth in the nation.

According to the quasi-public Connecticut Lottery Corp.'s most recent annual report, released in May, the lottery achieved record sales totaling nearly $1.1 billion in fiscal year 2012, an increase of $65.1 million from the previous fiscal year, the Day of New London reported.  The lottery credited a number of factors for its total sales increase, including higher sales of instant tickets and higher sales of multistate games, such as Powerball, Mega Millions and Lucky for Life. Also, 2012 was a leap year, meaning an extra day for sales.

For the first time in 15 years in fiscal year 2013 (which ended on June 30), the lottery is bringing in more revenue ($16 million) than both Foxwoods and payoutsMohegan Sun, WTNH-TV reported last week.  Lotteries are ubiquitous.  In North America every Canadian province, 43 U.S. states, the District of Columbia, Mexico, Puerto Rico, and the U.S. Virgin Islands all offer government-operated lotteries. Elsewhere in the world, according to NASPL, publicly-operated lotteries exist in at least 100 countries on every inhabited continent.

According to the U.S. Bureau of Economic Analysis, only seven U.S. states don't run lotteries: Alabama, Alaska, Hawaii, Mississippi, Utah, Wyoming, and Nevada. Of the 43 states that do run lotteries, the average payout is just under 60% of the revenue dollars collected. Using U.S. Census data, Bloomberg reported that of the estimated $50 billion spent on lottery tickets in 2010, only $32.8 billion was returned in prize money.

A previous Gallup Poll on Gambling in America found that 57% of American adults reported buying a lottery ticket in the past 12 months. People with incomes of $45,000 to $75,000 were the most likely to play -- 65 percent had played in the past year -- while those with incomes under $25,000 were the least likely to play at 53 percent. Further, people with incomes in excess of $75,000 spend roughly three times as much on lotteries each month as do those with incomes under $25,000, the National Association of State and Provincial Lotteries (NASPL) points out.

As Enrollment Climbs, Caliber and Diversity of UConn Students Also Increases

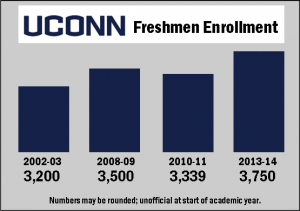
Five years ago, at the start of the 2008-09 school year, published reports trumpeted that “UConn is expecting about 300 more freshmen this fall compared to last, making the 3,500-strong class the largest in the school's history.  Déjà vu all over again, as students arrive on campus to begin the 2013-14 academic year. The state’s flagship university reports a freshman class of “approximately 3,750 members – the largest in the school’s history.”

UConn is also pointing with pride at a freshman class that has:UConn

  • an average SAT score of 1233, which outpaces last year’s incoming freshmen, whose average of 1226 had set the previous UConn record;
  • the most diverse group of students that UConn has ever recruited, with 27 percent of its members representing minority groups;
  • the largest number of Honors Program students (456) to enroll in UConn in a single year;
  • 149 valedictorians and salutatorians in the freshman class (continuing steady growth from 43 in 2002, according to the Daily Campus).

UConn’s new freshmen class draws 32 percent of its students from other states, the same level as in 2002.  In 2010, the Connecticut Post reported that out-of-state students made up 35 percent of the 3,339 freshmen who started their college careers at UConn's main caUConn enrollmentmpus and more than 26 percent of all 4,580 freshmen across the university's main and five regional campuses. That was up from 17 percent in 1995.

This summer, a record number of UConn students enrolled in summer school, taking advantage of incentives that include lower tuition and half-priced housing.  More than 8,800 students enrolled in one or both of the school's summer sessions, according to school officials.  That is up 22 percent from 2009, the year before the school began offering housing incentives for its summer programs.

UConn President Susan Herbst told the Day of New London this week that UConn plans to hire 259 new faculty members, 200 of whom will be teach the so-called STEM subjects - science, technology, engineering and math - and will enroll an additional 6,580 undergraduates in the coming yuconn-night1ears, after legislative approved of Gov. Malloy’s plan for more than $1.5 billion in bonding and $137 million from the state's general fund for "Next Generation Connecticut."  Total enrollment last fall was 30,250, including more than 17,000 undergraduates on its main campus in Storrs.

A decade ago, in October 2002, UConn reported that “freshmen enrollment at the Storrs campus has increased so significantly over the last five years that it will be maintained at about 3,200 students for the next few years."

Official  enrollment figures for the 2013-14 academic year will not be available until September.


Time Short to Nominate State’s Top Librarians; CT Seeks Another Stand-out Year

Nominations for the 2013 Carnegie Corporation of New York/New York Times I Love My Librarian Awards are open through September 6.  For Connecticut librarians, last year’s success will be tough to top.

The I Love My Librarian Award encourages library users to recognize the accomplishments of exceptional public, school, college, community college, or university liblove my librarianrarians. It is a collaborative program of Carnegie Corporation of New York, The New York Times and the American Library Association.

Ten librarians in 2012 – including two from Connecticut - received a $5,000 cash award, a plaque and $500 travel stipend to attend an awards reception hosted by The New York Times. A plaque was also given to each award winner’s library.

Rachel Hyland, a reference and collection development librarian at Tunxis Community College in Farmington, and Rae Anne Locke, library/media specialist at the Saugatuck Elementary “Secret Garden” Library in Westport, were two of the 10 recipients a year ago.  The others worked at libraries in New Mexico, California, North Carolina, New York and Florida.

In order to be eligible, each nominee must be a librarian with a master’s degree from a program accredited by the ALA in library and information studies or a master’s degree with a specialty in school library media from an educational unit accredited by the National Council for the Accreditation of Teacher Education.

rachel-hyland135rae-anne-locke135Nominees must be currently working in the United States in a public library, a library at an accredited two- or four-year college or university or at an accredited K-12 school.

Hyland (left), nominated by Sally Terrell, is described as “a rock-star librarian.  The intelligence, wit, energy she brings to her work has changed the way all of us – from students to faculty to administrators – think about information literacy.”  Locke (right) , nominated by Melissa Augari, has “poured her heart and soul into planning, creating and growing the SES Secret Garden Library, a vibrant, warm and inviting place that is much more than a school library. It is truly the learning hub for our entire school community.” Her collaborative projects “often reach out beyond the school community” and one student said simply, “it’s magical.”

In order to nominate a librarian, five questions must be answered on the contest’s website:

  • What sets him/her apart?
  • Please list a few ways in which the nominee has helped you and made your experience of the library a positive one. For instance, did the nominee inspire in you a love for literature; assist you in a project or finding other information?
  • How has the librarian made a difference in the community?
  • How has the library, and the nominee, improved the quality of your life?
  • How does the nominee make the library a better place?

More information is available at www.ilovelibraries.org. Nominations must be submitted using the online form, and submitted in their entirety.


love librarians

University of Hartford, Wesleyan on Top 25 List: Most Literary Colleges in America

The University of Hartford and Wesleyan University in Middletown have been named as among The 25 Most Literary Colleges in America, by the website Flavorwire. The list focuses on “which universities are the most literary friendly — which ones have the best teachers, the most famous alumni, and have the best environments for their more bookish students.”  Hartford and Wesleyan are the only Connecticut higher education institutions to make the list.

In describing the University of Hartford, the website noted that “While its neighbors in New York and Massachusetts might carry more name recognition, this school was originally founded by a group of the city’s upper class citizens during the Gilded Age, including Olivia Langdon Clemens (Mark Twain’s wife) and Harriet Beecher Stowe.”

Wesleyan University and the University of Hartford - both listed among the top ten on Flavorwire’s “Most Literary Colleges” list – are surrounded on the list by  bookschools including  Princeton, Harvard, Columbia, the University of Chicago, and many other prestigious institutions.

The website goes on to say that the University of Hartford “has a strong English department,” and it notes that the University “has given the Edward Lewis Wallant Award out to authors like Nicole Krauss and Dara Horn.” The Wallant Award, presented each year by the University’s Greenberg Center for Judaic Studies, is one of the oldest and most prestigious Jewish literary awards in the top-25United States.

In describing Wesleyan, the website noted that it is “One of the Little Ivies that is really big on books, V. S. Naipaul and T. S. Eliot both taught at this school that overlooks the Connecticut River, and with a list of writers like Daniel Handler (Lemony Snicket), Ayelet Waldman, Steve Almond, and many others, Wesleyan is without a doubt a writer’s college. “

New York-based cultural blog Flavorwire covers art, music, books, film, and design, seeking to connect viewers of the website with inspiring culture. It is part of Flavorpill Media, a community of writers, editors, developers, designers and sales and marketing creatives.

The top 25 most literary colleges in America,  from Flavorwire:

  1. Princeton University
  2. University of Iowa
  3. Brooklyn College
  4. Pomona College
  5. University of Hartford
  6. Wesleyan University
  7.  Sarah Lawrence College
  8. Oberlin College
  9. Williams College
  10. Vanderbilt University
  11.  Smith College
  12.  University of Mississippi
  13.  New York University
  14.  Colorado College
  15. University of Chicago
  16. Hamilton College
  17. Harvard
  18.  University of Illinois at Champaign-Urbana
  19. Sewanee:  The University of the South
  20.  Emerson College
  21. University of Texas at Austin
  22. Columbia University
  23.  Vassar College
  24.  Bennington College
  25. The New School


Cost of Raising A Child Is Highest in Northeast U.S., Including CT

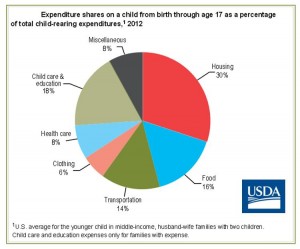
The cost of raising a child:  priceless.  Well, no, there is a price-tag.  The U.S. Department of Agriculture (USDA) released its annual report, Expenditures on Children by Families, which shows that a middle-income family with a child born in 2012 can expect to spend about $241,080 ($301,970 adjusted for projected inflation*) for food, shelter, and other necessities associated with child-rearing expenses over the next 17 years.

There was an overall 2.6 percent increase from 2011.  Expenses for child care, education, health care, and clothing saw the largest percentage increases related to child rearing from 2011. However, there were smaller increases in housing, food, transportation, and miscellaneous expenses during the same period. The 2.6 percent increase from 2011 to 2012 is also lower than the average annual increase of 4.4 percent since 1960.

The report notes geographic variations in the cost of raising a child, with expenses the highest for families living in the urban Northeast  - the 9-state northeast region, which includes Connecticut, Maine, Massachusetts, New Hampshire, New Jersey, New York, Pennsylvania, Rhode Island, and Vermont -followed by the urban West and urban Midwest. Families living in the urban South and rural areas have the lowest child-rearing expenses.report child expense

The report, issued annually, is based on data from the Federal government's Consumer Expenditure Survey, the most comprehensive source of information available on household expenditures. There is also  an interactive web version of the report where individuals can easily enter the number and ages of their children to obtain an estimate of costs through age 17.

Housing accounted for the largest share of total child-rearing expenses. For the middle and highest income groups (for households with the expense), child care and education was the second largest expenditure on a child, accounting for 18 and 23 percent of child-rearing expenses, respectively. For the lowest income group, child care and education accounted for 14 percent of total child-rearing expenses (again, for households with the expense). For lower income families, child care may be provided by relatives or friends at no cost due to affordability issues, the report pointed out.

Expenses per child decrease as a family has more children. Families with three or more children spend 22 percent less per child than families with two chchild expensesildren. As families have more children, the children can share bedrooms, clothing and toys can be handed down to younger children, food can be purchased in larger and more economical quantities, and private schools or child care centers may offer sibling discounts.

Among the largest potential costs in child-rearing is the cost of a college education, which was not included in this study, which only included direct parent expenses through age 17. The College Board estimated that in 2012-2013, annual average (enrollment-weighted) tuition and fees were $8,655 at 4-year public colleges (in-State tuition) and $29,056 at 4-year private (non-profit) colleges; annual room and board was $9,205 at 4-year public colleges and $10,462 at 4-year private colleges. For 2-year colleges in 2012-2013, annual average tuition and fees were $3,131 at public colleges. These college costs may be offset by financial aid.

The report concluded, as only a government report could, by stating: “The direct and indirect costs of raising children are considerable, absorbing a major share of the household budget. On the other hand, these costs may be outweighed by the benefits of children.”

The full report is available on the web at www.cnpp.usda.gov. A video highlighting the report is at http://www.youtube.com/watch?v=Di14Y3kTbHE

Mathematics and Transportation of Cities Draws New Research Analysis

UConn researchers have collaborated to develop a new index that will measure the sustainability of complex urban transportation systems.  The index will allow policymakers, scientists and the public to understand not just how congested cities’ transportation systems are, but the economic, social, and environmental impacts of the system as a whole.

A team of researchers in UConn’s departments of geography and civil and environmental engineering developed The Transportation Index for Sustainable Places, or TISP.  The new approach is part of the July themed issue of the journal Research in Transportation Business & Management, edited by  Carol Atkinson-Palombo, assistant professor of geography, Norman Garrick, associate professor of civil and environmental engineering, and Wesley Marshall, a former graduate student of Garrick’s who is now a faculty member at the University of Colorado, Denver. TISP

“Policy in developed countries and in the U.S. in particular has tended to focus on relieving congestion and has largely ignored social and environmental impacts associated with expanding freeways,” says Carol Atkinson-Palombo. “This index takes a more holistic approach, which gives a comprehensive sense of the effects of the system.”

The TISP takes into account environmental factors like land use efficiency, minimizing natural resource consumption, and reducing greenhouse gas emissions. Social factors are also measured, such as meeting access needs, incorporating public health and safety and maintaining a community in areas served by transportation. These factors combine with economic measures, such as affordability, self-sufficiency, and efficiency, to create a comprehensive metric, UConn Today reported.

Garrick says that many people only think about transportation in terms of traffic. These so-called congestion indices, he says, are misleading because they are not necessarily about making the city better, but simply moving cars more efficiently.

“In many cities, only 40 percenNewHavenRoute34aftert of the people commuting are in cars,” he points out. “The majority of the people aren’t affected by the congestion index, yet this is the only measure of the impact of the transportation system that is ever discussed in the media.”

Mathematics of Cities

In another initiative aimed at taking a closer look at the function of cities, the view that cities are dissimilar and disordered systems has begun to change.  Patterns have emerged within the supposed chaos, and researchers in economics, physics, complexity theory and statistical mechanics have concluded that cities, mathematically speaking, might actually be basically the same. Though strikingly different in culture and layout, cities like London and Beijing, for example, share many properties with regard to infrastructure, social interactions and productivity.

The new conclusions – decades in the making - are part of a growing field dedicated to the science of cities, Science News, the magazine of the Society for Science & The Public, reports in its most recent edition.   Roughly 75 percent of people in the developed world now live in urban environments. While much of the research is in its early days, eventually it may serve as a powerful, widely used tool for urban planners and policymakers, the publication reports.

Physicist and complex systems scientist Luís Bettencourt of the Santa Fe Institute in New Mexico has developed a theory which captures the interplay between a city’s population, its area, the properties of its infrastructure and its social connectivity. His theory suggests that city planning should not involve grand, top-down projects, but perhaps well-considered smaller ones.

The mathematical work is rooted in and reinforces the view “that cities grow from the bottom up,” says Michael Batty, who trained as an architect, planner and geographer and went on to found the Centre for Advanced Spatial Analysis at University College London. “The diversity of life [in cities] offers greater opportunities for mixing ideas.”

The emerging mathematical theory of cities stands on four basic assumptions:

  1. Cities mix varied people together, allowing them to reach each other.
  2. Cities are networks that grow gradually and incrementally, connecting people.
  3. Human effort isn’t limitless and stays the same regardless of urban size.
  4.   Measures of the socioeconomic output of a city — things like the number of patents awarded or crime rate — are proportional to the number of social interactions.

 “In a nutshell, the city is the best way of creating a vast, open-ended social network that minimizes the cost of moving things in and around an environment,” Bettencourt says. “When people brush up against each other, that’s when the magic of the city happens — the social reactor begins to work.”

Cities Reshape Transportation Mix

At UConn, when the research team used the TISP index to look at transportation in the U.S., they found some not-so-surprising results: areas with higher rates of driving rather than public transportation have greater carbon emissions, and having more cars and highways increases traffic fatality risk.  But despite the prevailing perception, says Garceau, the researchers found that decityveloping varied transportation systems that include a combination of roads and public transportation are more cost-effective than simply building highways.

Many cities have already begun to adjust their transportation planning. Some have begun dismantling freeways that run through their downtowns to reconstruct a truly urban atmosphere. New Haven is in the midst of doing precisely that in Connecticut, eliminating the Route 34 connector and replacing it with an urban boulevard that will reconnect city neighborhoods cut off for decades.

Others cities are moving forward with light rail and bus rapid transit systems (such as CTfastrak between Hartford and New Britain, now under construction) and encouraging walking and bicycle use by building compact, mixed-use communities that focus on pedestrians rather than cars.  Garrick points to Cambridge, Mass., Portland, Ore., and New York City as U.S. cities that have taken strides toward sustainable transportation. On a smaller scale, he cites Storrs, the home of UConn’s main campus, for developing a walkable town center from scratch, and planning for greater bus access as the newly-minted downtown area unfolds.