Organ Donation Draws Renewed Attention as Data Points to Acute Need

In the United States, 56 percent of the patients waiting for organ transplants are individuals of color, even though they account for 36 percent of the total population.

“While successful matching between donors and recipients does not take race or ethnic background into consideration, since we really all can help each other, more donors from all backgrounds will only result in fewer deaths on the waiting list,” says Caitlyn Bernabucci, Public Education Specialist for LifeChoice Donor Services. “Compatible blood and tissue types, which are a part of the donor and recipient matching process, are commonly found in people with similar backgrounds and ethnicities.”

To bring attention to the issue, August 1-7 is designated National Minority Organ Donor Awareness Week.  This is a nationwide observance to educate people of the need for donation and transplantation within the multicultural community, and how to register their decision to donate.

Today, nearly 199,000 people are on the national organ transplant waiting list. Largely due to the rarity of donation opportunities, only about 28,000 organs are transplanted each year. As a result, 18 people die each day due to the lack of a donor.

Currently, Hispanics/Latinos comprise 16% of the population, 19% of those waiting for a kidney, and 17% of those waiting for a liver, the federal agency reports.  According to the U.S. Department of Health & Human Services (HHS), African-Americans, Asians and Pacific Islanders, and Hispanics/Latinos are three times more likely than Caucasians to suffer from end-stage renal (kidney) disease, often as the result of high blood pressure and other conditions that can damage the kidneys. Almost 35 percent of the more than 95,000 people on the national waiting list for a kidney transplant are African-American.

In Connecticut, as of July 19, 2013, the waiting list for all organ transplants for Connecticut residents includes 1,368 individuals.  The ethnicity breakdown, according to official statistics, includes 668 whites, 457 blacks, 198 Hispanics, and 42 Asian.  Overall in Connecticut, individuals on the waiting list include 1,151 seeking kidney transplants, 192 awaiting liver transplants, 17 waiting for a pancreas transplant, and 25 hoping for a heart transplant.

HHS data indicates that in 201Waiting List by Ethnicity2, Hispanic recipients were 14.1 percent of the total organ transplants in the U.S, reflecting 15.8 percent of kidney transplants in the nation.  Among Hispanics, 66 percent of transplant recipients received kidneys and 22 percent received livers.  African-Americans received 19.9 percent of all organ transplants, including 24.8 percent of kidney transplants.  HHS reports that since 1996, the number of non-white donors has doubled.

“A disproportionately high number of minorities are currently in desperate need of an organ transplant. The need is so great in these communities mainly because diseases that cause end stage renal failure and the need for a kidney transplant, such as uncontrolled high blood pressure and diabetes, tend to impact this group more than others,” adds Bernabucci.

Although organs are not matched according to race/ethnicity, and people of different races frequently match one another, all individuals waiting for an organ transplant will have a better chance of receiving one if there are large numbers of donors from their racial/ethnic background. This is because compatible blood types and tissue markers—critical qualities for donor/recipient matching—are more likely to be found among members of the same ethnicity, the federal agency points out, adding that “a greater diversity of donors may potentially increase access to transplantation for everyone.”

Originally launched in 1996 as National Minority Donor Awareness Day on Aug. 1, the one-day observance became a week-long designation at the request of organ procurement organizations (OPOs) and other organ donation partners throughout the country, according to Texas organ transplant officials.

LifeChoice Donor Services, Inc. is the federally designated, non-profit organ procurement organization (OPO) for six counties in Connecticut and three counties in Western Massachusetts with a combined population of 2.2 million people.  The OPO serves twenty-three acute care hospitals for organ and tissue donation and two organ transplant hospitals, Hartford Hospital in Hartford, CT and Baystate Medical Center in Springfield, MA. Organ transplants include kidney, liver, pancreas, heart, lung and intestine.

Donate Life New England is a joint project of three federally designated organ procurement organizations that serve New England – New England Organ Bank, LifeChoice Donor Services, The Center for Donation and Transplant, the Connecticut Eye Bank, as well as Donate Life Connecticut. For more information about LifeChoice and to join the Donor Registry, please visit www.lifechoiceopo.org or call 1.800.874.5215.

Mapping of Introduced Legislation Shows Subjects of Most Interest

Wondering in which subject areas the greatest volume of proposed legislation was centered during the 2013 Connecticut General Assembly session?  There’s a map for that.

Data compiled and presented in a brightly colored, multi-layered, interactive display by the website Readily Apparent illustrates the leading legislative areas of focus, based on the number of bills introduced by lawmakers during the five-month session that concluded in June.

Leading the way in 2013 was Government Administration and Elections with 458 proposed bills, followed by Criminal Justice and the Courts with 320, Education with 248, Public Safety & Security with 194 and Public Health with 181.

In each of 23 subject areas, Readily Apparent “drills down” to break each subject into subcategories – visible with the click of a mouse.square map

In Government Administration & Elections, for example, the breakdown, also visually displayed, is 246 bills related to state government operations, 93 dealing with elections, 62 focused on the legislature, 29 on government contracts, 24 on municipalities, and 4 on regulated activities.  Each of those categories is subdivided further.  The “state government operations” category, for example, includes six distinct sub-categories.

In addition to the three levels of breakdowns, the website also provides a listing of all the bills introduced in each category, forming a comprehensive list of bills introduced to be considered by lawmakers during the legislative session.

The site describes the “What’s Getting Lawmakers Attention” tree-map interactive data display as providing a “30,000-foot view” of activity by policy area in the 2013 CGA session.

Readily Apparent co-founder Brendan Hanrahan’s primary interest, according to the website, “is in conveying new insights that can be gained with the use of relational data designs and dynamic graphics.  He has been exploring, designing and developing web-based applications for data management, analysis and visualization since 2004.

Quinnipiac, Eastern, Middlesex Among Nation's Great Colleges to Work For

The Chronicle of Higher Education has named three Connecticut institutions - Eastern Connecticut State University, Quinnipiac University and Middlesex Community College – as among the top schools in the country for the people who work there.

The Connecticut schools are among 97 institutions across the United States to achieve the title ‘‘Great College to Work For’’ in recognition of best practices and policies.

The results of the analysis, based on an institutional audit of demographics and workplace policies as well as a survey of more than 45,000 faculty, administrators and professional support staff at 300 colleges and universities, are part of the publications’ sixth annua2013GCWF_logol report.

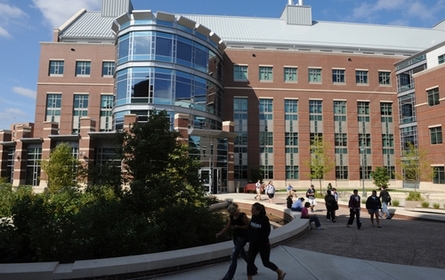
Quinnipiac University reached the Chronicle’s great colleges to work for list for the first time; Eastern Connecticut for the fifth consecutive year.  Middlesex Community College debuted on last year’s list.

Among the “outstanding features” described by the Chronicle about Quinnipiac: “The university’s wellness initiative pits teams of employees against one another in friendly competition. Quinnipiac administrators say thquinnipiace atmosphere has lightened the mood at faculty meetings and helped employees maintain a more healthful lifestyle.”

Quinnipiac not only made the list, but earned a spot on the Honor Roll as well – one of just 10 medium-size 4-year colleges to do so.  Those institutions were described as “the best of the best.”  Quinnipiac was recognized in eight of the publication’s 12 categories:  Collaborative Governance, Compensation and Benefits, Confidence in Senior Leadership, Facilities, Workspace & Security, Job Satisfaction, Professional Career Development Programs, Respect and Appreciation, Teaching Environment, and Tenure Clarity and Process.

Eastern was noted in three categories: collaborative governance, compensation and benefits, and facilities, workspace and security.  Eastern was previously recognized in 2009, 2010, 2011, 2012.  Among the university’s “outstanding features,” easternaccording to the Chronicle,  are the university’s announcement in April of “plans for a 135,000-square-foot arts facility; it follows the 2008 construction of a new science building. Eastern Connecticut has been recognized by the Princeton Review as a “green college” for four years in a row.”

“Receiving this national recognition from the Chronicle of Higher Education each of the past five years is very gratifying, especially given our high ranking in three important areas of campus operations. The spirit of collaboration that exists on our campus is a strength that helps us better serve our students and the state of Connecticut,” said Eastern President Elsa Núñez.

Middlesex was recognized for its compensation and benefits along with  professional/career development programs. The Chronicle noted that “At Middlesex, faculty are not the only employees eligible for tenure. Exempt professional staff may also apply for and receive tenure after six years of working for the college.”

UConn the Latest to Proceed with Scoreboard Replacement; Controversy Erupts at Penn State

When the State Bond Commission voted last week to approve $2.8 million for repairs to Rentschler Field in East Hartford, home of the newly rebranded Connecticut Huskies, it was said that about $1.67 million of that money will be used to replace scoreboards at the stadium.

The Hartford Courant reported that Kim Hart, the venue director for the Capital Regional Development Authority, which overssees the state-owned facility, said that scoreboards like the main one at Rentschler are typically replaced every 7 to 8 years.  The main scoreboard at the Rent has been in place since the facility opened, a decade ago.

“It’s outlined its useful life and we’ve squeezed a few years out of it,” she was quoted as saying.

For sports fans accustomed to seeing stadium scoreThe Rentboards in place for well over a decade at venues across the nation, the statement may have been jarring.  But apparently, new technology is driving new scoreboard purchases at colleges coast-to-coast – and at costs considerably higher than in Connecticut.

In 2012, Ohio State University announced plans to install a larger high-definition scoreboard screen and improved audio equipment as part of $7 million in upgrades at its football stadium.  The school said that the new 42-by-124-foot scoreboard at Ohio Stadium would  replace an 11-year-old board that measures 30 feet by 90 feet, the CBS affiliate in Cleveland reported.   When the new scoreboard debuted in August 2012, the school’s Lantern newspaper website reported that Don Patko, associate athletic director of Facilities Management, said the improvements were necessary and well worth the cost.  “It was time for the video board to be replaced,” Patko said. “The usual life for a scoreboard is 12 to 15 years, and the last one was 12 years old.”

When Brigham Young University announced plans for a new scoreboard in 2012, to be paid by corporate donations, it was noted that  “In 1996, a video wall was added to the south end zone and a matrix scoreboard to the north end zone. The north end zone scoreboard was updated in 2008 to include a small video board. The project will include state-of-art LED video walls in the north and south end zones, as well as LED ribbon boards across the top of both end zones.”

When North Carolina State University embarked on a fundraising drive for scoreboard replacement in 2011, Mark Steinkamp, a senior marketing director at Brookings, S.D.-based scoreboard provider Daktronics, told the StateFansNation that “large college football scoreboards can cost as much as several million dollars. Schools typically will replace them every seven to 10 years as new control and display technologies come along.”

Also in 2011, Penn State University launched a scoreboard replacement initiative.  In a letter to prospective design professionals, University Architect David Zenghut pointed out that “The existing main end zone scoreboards were installed prior to the 2001 football season and operational maintenance is becoming increasingly challenging and costly. In addition, there have been dramatic advances in the audio/video technology of these products. In order to address the operational issue and enhance the game day spectator experience, we intend to replace both scoreboards with state-of-the-art, HD video boards that will complement the character of the stadium.”

Penn State assumed a construction budget of $5.5 million, according to the document.  A year later, it was reported by StateCollege.com that the completion of the scoreboard replacement was pushed back from 2012 to 2014. And this week, with the projected cost now pegged at nearly $10 million, a local newspaper is calling for the project to be scaled back or scrapped.

The Centre Daily Times, in an editorial published on July 28, 2013, said “We question the decision to install a new scoreboard, approved at last week’s board of trustees meetings, … while costs tied to the Jerry Sandusky abuse scandal reached nearly $47 million. We wonder what the scoreboard decision says about the school’s priorities,” The newspaper continued “We’re surprised Penn State thought this was the right time to take an expensive step toward enhancing its athletics brand, the stated goal with the scorebodmrdc5-6a0bvtplo8316jj1q5nj_originalard, given criticism hurled at the university during the Sandusky scandal. Those same trustees meetings approved yet-another tuition hike — this one nearly 4 percent ...”

Just last month, progress in construction of a new scoreboard at the University of Iowa’s Kinnick Stadium was reported by the local ABC affiliate, which explained that “The video board/sound upgrades will be up and running for Iowa’s home football schedule this fall. The financing package the board approved for that Kinnick project totals $8 million, but they expect the total cost of everything will be $9 million because of the increase in bids on a portion of the project.  The existing video walls, control room equipment and sound system at Kinnick are eight years old, UI officials told The Gazette.  The company handling the project is Daktronics, Inc. As per usual, the Iowa athletics department will foot this bill using no tax or tuition cash.”

And earlier this year, Virginia Tech issued an RFP for a new scoreboard, which would be among the largest in college sports.

14 States and D.C. Have Recovered Recession-Lost Jobs; Connecticut Hasn't Yet

While employment has steadily climbed since the nation’s economic recovery began, only a few states have seen job levels return to pre-recession numbers thus far, and Connecticut is not among them.  Last month marked the four-year anniversary of the end of the recession in June 2009, and updated U.S. Department of Labor estimates published within the week show the extent to which states are rebounding.

The U.S. has recovered 5.3 million jobs since job losses bottomed out, still about 2.2 million below pre-recession levels, Governing magazine reported. Only 14 states and the District of Columbia have fully recovered jobs dating back to 2008. Of those, only oil-rich Texas, North Dakota and Alaska recorded notable job growth exceeding a couple percentage points.  In Connecticut, net employment is down 3.6 percent and in Rhode Island it’s down 4.5 percent. Employment is up one percent in New York, and nearly one percent in Massachusetts over that period.jobs-300x211

Across the country, North Dakota experienced a 20.6 percent gain in employment since the recovery began, by far the nation’s largest increase. The state's population also jumped, accordingly.  Texas (8.6 percent), Utah (7.8 percent) and Indiana (6.4 percent) recorded the next-highest percentage increases over the four-year period.

As residents of Connecticut have seen first-hand, Texas is aggressively job poaching.  The Lone Star State and California are in the midst of a well-publicized battle for jobs, with Gov. Rick Perry making numerous visits to California and airing radio ads courting the state’s employers. The two states collectively added nearly 1.4 million jobs since the recovery began, accounting for more than a quarter of the nation’s total job growth. Perry, of course, is also taking on New York, Connecticut and Illinois in his jobs-snatching corporate romancing.

Most states still have a long way to go before payrolls return to pre-recession levels, Governing magazine reports. Nevada’s unemployment rate remains the country’s highest at 9.6 percent. The state also has registered the largest percentage drop in employment since the recession began (-9.8 percent), followed by Arizona (-6.3 percent) and Alabama (-5.2 percent).

A map developed by the publication shows the extent to which each state recovered, with states shaded based on the percentage change in nonfarm employment since the recession began in January 2008 (the National Bureau of Economic Research determined the economy peaked in December 2007).

State economies didn't all peak or bottom out at the same time either, so the data represents snapshots since the official start of the recession.  Traditionally, Connecticut enters national recessions late, and emerges from them after most states as well.  Governing also notes that the data doesn’t take into account more people entering the labor force.

The U.S. Bureau of Labor Statistics recently reported that Federal government employment continued to trend down in June (-5,000) and has declined by 65,000 over the past 12 months.  Of particular interest in Connecticut due to its employment levels in the financial services industry, employment in financial activities rose by 17,000 in June, with most of the increase occurring in credit intermediation (+6,000) and in insurance carriers and related activities (+6,000), according to the Bureau.

Employment in professional and business services rose by 53,000 in June. Over the past year, the professional and business services category has added 624,000 jobs.  Leisure and hospitality added 75,000 jobs in June. Monthly job growth in this industry has averaged 55,000 thus far in 2013, almost twice the average gain of 30,000 per month in 2012. Employment in the amusements, gambling, and recreation industry also continued to trend up in June (+19,000).

change in jobs

Free Summer Meals Program for Children Aims to Provide Nutrition, Sustain Academic Progress

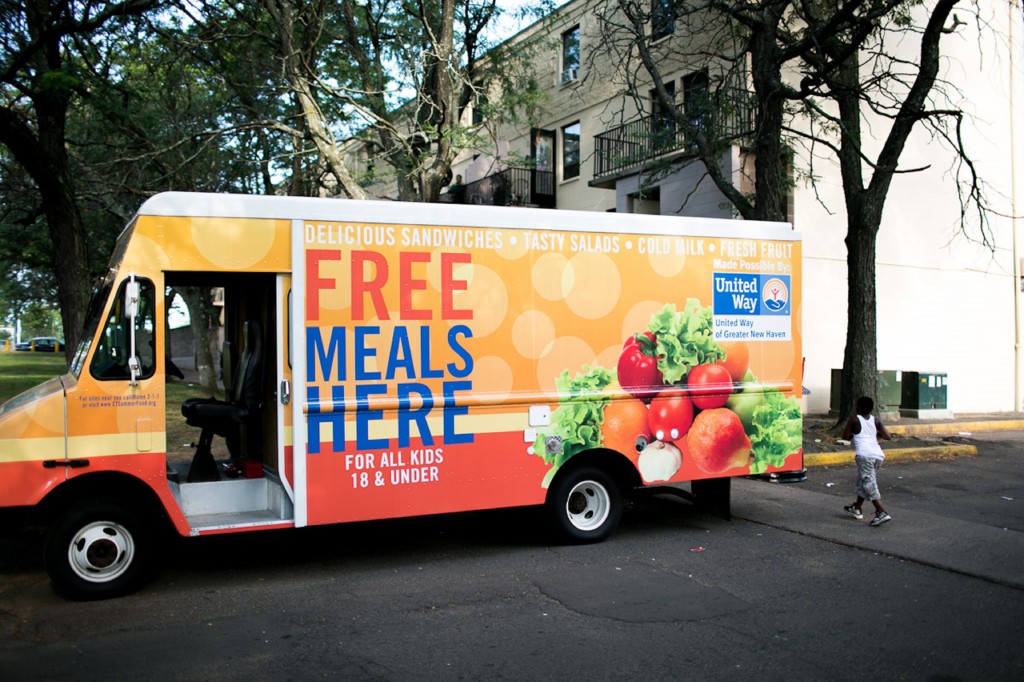
Turns out, there is a free lunch.  In fact, Connecticut’s summer meal program for children 18 and under is providing hundreds of lunches – and breakfasts.  As Governor Malloy points out in a radio commercial now being broadcast around the state, 3 in 4 Connecticut children who could receive free meals aren’t doing so.

Officials say that the absence of good nutrition over the summer – when children are out of school and school lunch programs are unavailable - may contribute to children slipping somewhat in their educational progress.  “Summer learning loss,” they say, may be caused in part by “summer nutrition loss.”  The free Summer Meals program aims to turn that around.

The statistics are startling.  There are 100,000 children in Connecticut who don’t know where their next meal is coming from, according to Lieut. Gov. Nancy Wyman, who helped to kickoff the statewide initiative, and joins the Governor in the radio announcement.   That is why more than 400 locations around the state,  including churches, parks, schools and even some pools, are serving free meals to children throughout the summer afree lunchs part of the summer meals program and the state’s ongoing End Hunger Connecticut initiative.

A new interactive website, www.ctsummerfoods.org, was launched at the beginning of the summer that lists all the locations serving the meals.  The site allows people to simply type in a town or zip code to see a list of locations in that area that offer the meals.

Children and teens, under 18, do not have to be receiving free or reduced price school meals during the school year to eat a free, nutritious, summer meal and/or snack at participating locations.  Connecticut ranks 5th in country, as of 2012, for such programs, with  about 25% of children who are eligible are receiving the breakfasts.  “We need to do better,” said Stefan Pryor, Commissioner of the State Department of Education, when the program began just after the school year ended.

The program website notes that “Only 25.8 of every 100 low-income students that participate in school lunch also participate in summer nutrition. If participation reached 40 percent, an additional 19,558 students would be reached and that would bring an additional $1.35 million federal dollars into the state.”

By heightening visibility of this program, the Connecticut No Kid Hungry campaign and its partners aim to increase participation in the state’s 2013 summer meals program by 9 percent. Flyers and other program material is available on-line to help local organizers get the word out in their communities.

In launching the program, “Blitz Days” were held in Hartford, Groton, Naugatuck, Norwalk and Waterbury to bring attention to the initiative, which is mostly funded by the federal government.  CT News Junkie has reported that program organizers don’t ask too many questions of those coming to receive meals. Income guidelines are not required because the idea is not to discourage anyone from receiving a meal, state officials said.

Last year the state of Connecticut received 20120717-ShareOurStrength_CT-0062-slider$1.55 million to administer the program. The bulk of that or $1.3 million was used to purchase food. Summer meals are paid for by the United States Department of Agriculture (USDA). The Connecticut State Department of Education works with the USDA to reimburse sponsors for the summer meals they provide to children and teens, under 18, at participating summer meals locations.

For details on dates and times that meals and/or snacks are being served at particular locations, individuals can use the Location Finder, text “CTmeals” to 877877, or call, toll-free, 2-1-1.  It is anticipated that the program will continue until the start of the school year in late August.

Patients Rate Hospitals in CT: Middlesex, Danbury, St. Vincent's Top Lists

When asked how they rated their hospital stay, about two-thirds of patients in Connecticut hospitals offer the highest, or very high, ratings.  And when asked if they would recommend the hospital to friends and family, a greater number, 72 percent on average, say they “definitely” would.  A closer look at the number  included in the U.S. News report on best hospitals, shows distinctions among Connecticut’s medical institutions – according to their patients.

Those receiving the largest percentage of very high overall ratings from patients are Middlesex Hospital (76%), St. Vincent’s Medical Center (73%), Danbury Hospital (72%) and Yale-New Haven Hospital (68%) – the only facilities to exceed the statewide average of 66 percent.

Topping the liPatient-Survey-st of those that would definitely be recommended to family and friends by patients were Middlesex Hospital and Danbury Hospital, both with 79%, and St. Vincent’s Medical Center and Yale-New Haven Hospital, each with 77%.  Others exceeding the statewide average of 72 percent were St. Francis Hospital and Medical Center, Hartford Hospital, and Stamford Hospital, all with 73 percent.

The hospitals with the lowest percentage of patients offering the highest overall rating were Waterbury Hospital and Bristol Hospital.  The lowest percentage who would recommend the hospital at which they were patients to their friends and family were Charlotte Hungerford Hospital in Torrington, Bristol Hospital, and Waterbury Hospital.

In addition to those responses, data is developed based on patient responses to questions related to pain control, staff courtesy, cleanliness of facilities, staff responsiveness to patient needs, and information provided related to discharge and recovery.

The data was compiled in August 2012 and release this month.

patients say

New Leadership at UConn's Roper Center for Public Opinion Research

There is new leadership at the helm of UConn’s Roper Center for Public Opinion Research - the leading educational facility in the field of public opinion. Paul Herrnson takes over this week as Executive Director of the Roper Center, and joins the faculty as a Professor of Political Science. The Roper Center, which was founded in 1947, promotes the intelligent, responsible and imaginative use of public opinion in addressing the problems faced by Americans and citizens of other nations. Dr. Herrnson comes to UConn from the University of Maryland, where he was a Professor in the Department of Government and Politics and recipient of outstanding teaching awards from the University and the American Political Science Association. He was also the Founding Director of the Center for American Politics and Government at the University of Maryland.roper

The Roper Center is an archive—it preserves the data from polls conducted by many leading survey organizations for the use of researchers, students, and journalists. Its collection now includes 18,000 datasets and continues to grow by hundreds of datasets per year. In total, it includes responses from millions of individuals on a vast range of topics.

Since its beginning, the Roper Center has focused on surveys conducted by the news media and commercial polling firms. However, it also holds many academic surveys, including important historical collections from the National Opinion Research Corporationherrnson and Princeton University's Office of Public Opinion Research.

Today, the Roper Center Facebook page includes current polling data from around the world, including questions culled from recent surveys on breaking news and topical events.

Herrnson is a well-published scholar whose research papers have appeared in the leading journals. His recent books include: Interest Groups Unleashed (2012), and the 6th edition of his widely used text, Congressional Elections (2011). According to the University of Maryland web site, Herrndon’s “dedication to civic responsibility and the political process fuels a number of activities on local and national levels.” He has provided expert testimony to the Maryland legislature, U.S. Congress and federal courts in the areas of voting technology, ballot access and campaign finance.

When the Center was launched, Elmo Roper and others in the emerging field of survey research recognized that the information they were gathering should be preserved for future generations of scholars, students, and journalists. Since that time, the Roper Center has continued to acquire and archive public opinion data.

Since its founding, the Center has maintained two key objectives: (1) to preserve the voice of the public in the form of public opinion polling data and maintain these data in the most current formats possible, and (2) to re-disseminate the data in detailed and complete form via intuitive access tools.

Most of the surveys in the Roper Center are national samples, but there are also some state and local surveys, as well as a number of surveys of special populations of interest. Nearly all of the surveys are based on representative samples drawn according to the best practices of the time. The Roper Center now focuses on data from the United States, but continues to acquire some surveys from other parts of the world, particularly Latin America.

The Roper Center contributes to education at the University of Connecticut.  Although the Roper Center does not offer any degree programs, it works with a wide range of programs-including the departments of Political Science, Sociology, and Statistics—in giving employment and research opportunities for graduate and undergraduate students.

Waterbury, New Haven Among Nation's Leading Cities for Healthcare Social Workers

Connecticut, always on the lookout for occupations with strong potential for job growth, appears to already have one in our midst.  New statistics indicate that Waterbury and New Haven are among the top five metropolitan areas in the nation for healthcare social workers – a status that could serve to attract individuals in the fast-growing field to the state.

Nationwide, the median salary for a healthcare social worker is $47,770, and the job outlook is bright: jobs are projected to grow 26 percent from 2010 - 2020, which is twelve percentage points above the projected national job growth of 14 percent.  In Waterbury, the median salary is $65,250, the second highest in the nation; in New Haven, ranked at #5, it is $61Waterbury CT,950, according to data compiled by the data analysis website ValuePenquin.

Healthcare social workers are professionals who provide a range of services that support patients' medical needs in their psychosocial environment, from advising caregivers to coordinating medical services.  With healthcare becoming increasingly complex, the need for healthcare social workers has grown, as reflected in the analysis that determined the Best Cities for Healthcare Social Workers, based on May 2012 data.

The U.S. Bureau of Labor Statistics has reported that Connecticut is ranked fourth nationwide in  job prospects and has the fourth highest annual wages, at $60,830.  The Bureau defines the occupation as one that provides individuals, families, and groups with the psychosocial support needed to cope with chronic, acute, or terminal illnesses.  Services include advising family care givers, providing patient education and counseling, and making referrals for other services. Individuals in the field may also provide care and case management or interventions designed to promote health, prevent disease, and address barriers to access to healthcare.

In the ValuePenquin study methodology, median annual pay - a substantial factor in the decision process for people looking for work – was considered, along with how expensive the city is to live in.  Since the focus was on job opportunities, the study also factored in cities’ concentration of healthcare social workers. The ‘location quotient’ measures the concentration of a particular occupation in a city as a proportion of all occupations relative to the national average. They infer a higher location quotient to mean a relatively higher demand for a profession's services.  Data from the Bureau of Labor Statistics underscored the recent study, ranking Connecticut fourth in the nation in location quotient, reflecting a field in demand.

While the study ranked Waterbury and New Haven in the top five, Massachusetts communities also had a strong showing, reflecting the regions attractiveness for professionals in the field.  The top ten:

  1. Carson City, NV
  2. Waterbury, CT
  3.  Cumberland, MD
  4. Taunton/Norton/Raynham, MA
  5.   New Haven, CT
  6.  Napa, CA
  7.  Yuba City,  CA
  8.  Springfield, MA
  9. Boston/Cambridge/Quincy, MA
  10. Hanford/Corcoran, CA

In addition, New Bedford ranked #14, Worcester was #16, Brockton/Bridgewater/Easton, MA was #17, Providence/Fall River/Warwick was #18, Pittsfield was #19 and Barnstable was #20.

BLS

Hour-Long Commutes to Work Rank CT 36th in USA; Bridgeport 5th in Extra Travel Time on Fridays

Connecticut is a relatively small state.  Only Rhode Island and Delaware are smaller.  Yet, the percentage of workers in Connecticut who commute for 60 minutes or longer - one way -  to go to work each day is 7.7 percent.  That ranks the state 36th in the nation in percentage of workers commuting an hour or longer each trip to get to work.

Perhaps surprisingly, Connecticut is not among the states with the lowest percentage of workers needing to make an hour-long commutes to get to work each day.  In fact, more than a dozen states have a smaller percentage of long-commute drivers than Connecticut.  The lowest percentages of long commutes are in South Dakota (3.6% of workers), Iowa (3.7%) , Kansas (3.3%)  and Nebraska (2.9%). The study compared 2011 data.

The states with a larger percentage of their workforce making hour-long commutes includes California (10.1%), Delaware, D.C., Georgia, Hawaii, Illinois, Maryland, Massachusetts, New Hampshire, New Jersey, New York, Pennsylvania, Puerto Rico, Virginia, Washington and West Virginia.  Connecticut ranks 22nd in population among the states.

Overall, Connecticut’s average commuting time ranked 19th in the nation, at 24.6 minutes, based on 2006-2010 data compiled by the website indexmundi.org.  The U.S. average was slightly higher at 25.2 minutes.  Among the state’s eight counties, the longest commutes – in time, not distance – were in Fairfield County, followed by Litchfield, Windham, Tolland, Middlesex, New Haven, New London and Hartford counties.cities

The website trulia.com provides graphic representations of travel time from areas surrounding major cities, including Hartford, New Haven and Bridgeport in Connecticut - looking at travel by car, and via mass transit.

A year ago, the Bridgeport metropolitan area was ranked as the 5th worst traffic delay corridor in the country by Governing magazine.  Data compiled for Governing by traffic research firm Inrix shows Friday afternoons are the worst time of the week to drive in nearly three-quarters of metro areas across the country.  For most cities with already lengthy rush-hour commutes throughout the week, time spent behind the wheel is further prolonged on Fridays.

Bridgeport came in just behind Los Angeles, San Francisco, Honolulu and Austin, Texas – and worse than Seattle, New York City, Portland, Washington and Chicago, which all fared somewhat better than the Park City in the Friday-afternoon traffic tie-up analysis done by the publication.    Areas with many workers living far outside a city can experience significant congestion when all flee the office early, the publication noted, citing Bridgeport, which recorded the nation’s fifth-longest Friday afternoon delays, as an example.

For the Bridgeport area, commuters added nearly 10 minutes in delays due to traffic congestion on Friday afternoons.  Boston, by comparison, added just under 7 minutes, New Haven 5 ½ minutes, Hartford just over 4 minutes.  Los Angeles, which topped the list, exceeded 13 minutes in the additional travel time necessary during car commute NHthe peak commute due to the traffic volume.

transit commute NH