Connecticut Ranks #22 in Motor Vehicle Thefts; Rate Drops 3 Percent

Connecticut ranks #22 in the nation in motor vehicle thefts, with 238 thefts per 100,000 registered vehicles, a one-year drop of 3.3 percent, according to the most recent full-year data.

The District of Columbia had the greatest theft rate, with a total of 3,661 vehicles stolen and 322,350 registered vehicles in D.C.  That reflected a reduction in thefts of 18 percent in 2012 as compared with 201auto theft map
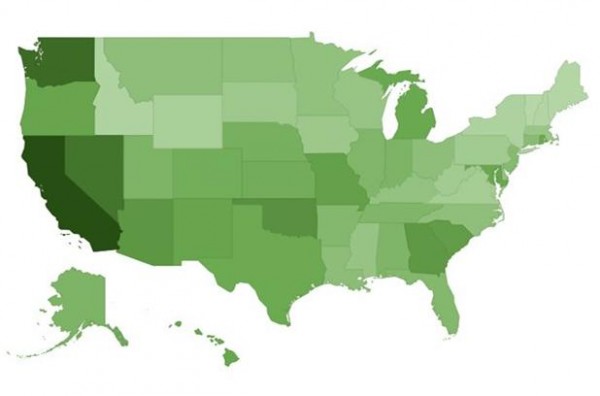
1, but still outdistanced all 50 states.

Rounding out the top 10 states with the highest rate of car thefts were California, Nevada, Washington, Maryland, Georgia, Arizona, South Carolina and Oklahoma.  Among the New England states, Rhode Island ranked #12, Massachusetts was #34, Maine was #47, New Hampshire was #49 and Vermont was #51, with 435 thefts and 606,941 registered vehicles – the lowest rate in the nation.

In Connecticut in 2012 there were 6,449 motor vehicle thefts.  The state has 2,706,459 registered vehicles.fbi-logo-large

The data was compiled by Bloomberg.com based on information from the Federal Bureau of Investigation (FBI) Uniform Crime Reports, and U.S. Department of Transportation Federal Highway Administration.

According to data compiled by the FBI and provided by the Criminal Justice Information Services Division:

  • There were an estimated 721,053 thefts of motor vehicles nationwide in 2012. The estimated rate of motor vehicle thefts was 229.7 per 100,000 inhabitants, placing Connecticut’s car theft rate  just above the national average.
  • The estimated number of motor vehicle thefts increased 0.6 percent in 2012 when compared with the 2011 estimates, but declined 24.8 percent when compared to the 2008 estimates, and 42.8 percent when compared to the 2003 estimates.
  • More than $4.3 billion was lost nationwide to motor vehicle thefts in 2012. The average dollar loss per stolen vehicle was $6,019.
  • In 2012, of all motor vehicles stolen, 73.9 percent were automobiles.

Want a Snow Day off from School? It Takes Less Snow in Southern CT

The forecast calls for snow Sunday night into Monday morning, and with it comes the possibility of school cancellations.  Whether or not students receive a snow day – in Connecticut and across the country – has everything to do with where they live, more than the depth of the snowfall.

Connecticut, more than many states, seems to have varying standards across the state, if data recently published by the website flowingdata.comconnecticut snow, based on a nationwide map developed using county-by-county data, is to be believed.

The data indicates how much snow, on average, it takes to close schools across the country.  Not surprisingly, in the northern states it takes quite a bit, while in the southern U.S. even the slightest snowfall can keep school children home.

In Connecticut, however, there appears to a less than uniform standard.  In the states’ southernmost counties – including Fairfield, New Haven, Middlesex and New London - it generally takes 3 - 6 inches of snow to close schools.  In the counties across the upper tier of the state – including Litchfield, Hartford, and Tolland, it takes 6 to 12 inches.

Windham Country, in the northeastern corner of the state, tends more toward the 3-6 inch line of demarcation.  State law in Connecticut  requires at least 180 school days per year, but individual districts—including those experiencing identical weather—often have vastly different ways of accommodating cancellations within the academic calendar.  A morning review of the school closing list on any of the major television stations demonstrates the inconsistencies beyond doubt.

The data does not account for ice storms and other winter conditions that can impact when local school superintendents decide to postpone a day’s school.  The data also does not reflect early dismissals or delayed arrivals due to weather conditions.

Across the nation, in much of the Midwest and Great Plains, school closing often depends more on wind chill and temperature than on snow accumulation. It has also been pointed out that school closures tend to say more about an area's infrastructure than the toughness of its citizens.  The recent impact on Atlanta and other Southern cities when hit with a relatively modest storm reflected that reality.

According to the Connecticut Department of Energy and Environmental Protection, the month of March brings, on average, 4.2 inches of liquid precipitation and 9.3 inches of snowfall.  In 1994, however, a record 83.1 inches of snow fell, the most since record-keeping began in 1905.

  snow cancel

The map was developed by Alexandr Trubetskoy.

CT Historical Society Kicks off Community History Tour 2014

Connecticut residents with an opinion on how the state – and its local communities - can best celebrate Connecticut’s history are being given an opportunity to share their views by the Connecticut Historical Society (CHS), which has launched Community History Tour 2014 in an effort to build deeper relationships with local communities throughout the state.

CHS is conducting nine regional town hall-style discussions, hosted by local organizations, with the public and area organizations with an interest in history encouraged to participate. With an active heritage organization in nearly every one of the state's 169 towns, the CHS has aspirations to build stronger bridges with local Connecticut residents throughout the state. chsmllogo

The purpose of the listening tour is to engage local organizations and residents in a broad statewide conversation exploring how to celebrate the state’s history in ways that are relevant to today’s audiences.

The sessions kicked-off on February 11 at the Stanley-Whitman House in Farmington, and the next session will be on Monday, March 3 in Hartford at CHS.  It will be followed by open meetings in New Haven, Willimantic, Fairfield, Greenwich, Waterbury, Old Lyme and Litchfield over the next two months.

"Connecticut is a state rich in history," says Jody Blankenship, director at CHS, "and we know people like to experience history in different ways. We want to better understand how the state's communities feel about that. Do they want to see more or less of it? How do they want to see that happen, and how can we help? We're ready for a no-holds-barred conversation."map CT  Connecticut-finley-1827

The Connecticut Historical Society is a private, not-for-profit museum, library, research and educational center. The organization’s mission is to inspire and foster a life-long interest in history through exhibitions, programs, and Connecticut-related collections.  The CHS website notes that “improving knowledge of the past enhances understanding of the present and the ability to meet the challenges of the future.”

Founded in 1825, the Connecticut Historical Society houses an extensive and comprehensive Connecticut-related collection of manuscripts, printed material, artifacts and images that document social, cultural, and family history.  It is located in Hartford.

"Our goal is to better understand what makes each community special and how the history of that town or area is integrated into the Connecticut fabric. The best way to do that is ask those who are passionate to tell us," Blankenship added.


Community History Tour 2014 Dates and Locations: (All meetings occur at 4:30pm, unless otherwise indicated.)calendar

February 11: Stanley-Whitman House, Farmington March 3: Connecticut Historical Society, Hartford March 10: New Haven Museum, New Haven March 15: Windham Textile Museum, Willimantic, 11:00am March 31: Fairfield Museum, Fairfield April 7: Greenwich Historical Society, Greenwich April 8: Mattatuck Museum, Waterbury April 15: Florence Griswold Museum, Old Lyme April 21: Litchfield Historical Society, Litchfield

Weston, New Canaan Among Nation’s Richest Zip Codes

Weston and New Canaan are among the richest zip codes in the nation, according to an analysis by a University of Washington researcher.  Based on data from the U.S. Census Bureau’s American Community Survey, the batting order of the nation’s richest zip codes includes the two Fairfield County communities – Weston at #10 and New Canaan at #11.

zip codes
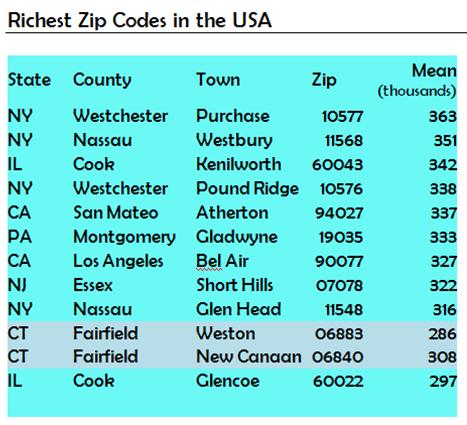
The zip code with the highest and the 4th highest incomes are in Westchester County, close to the Connecticut border. The second richest, Westbury, is in Nassau county, New York, which also has the 9th richest. Also in the New York City suburbs are the 8th, in New Jersey just 20 miles west of New York, while 10th and 11th richest are both located in Fairfield County, according to Richard Morrill, Professor Emeritus of Geography and Environmental Studies at the University of Washington, who outlined his research in newgeography.com.

The top 10 communities, by zip codes, are Purchase, N.Y.; Westbury, Long Island; Kenilworth, Illinois, Pound Ridge, N.Y., Atherton, California; Gladwyne, Pennsylvania; Bel Air, California; Short Hills, New Hersey, Glen Head, Long Island; followed by Weston and New Canaan.

“The most astounding thing about the map,” (which shows the “rich” zip codes by the county they are part of) Morrill points out, “is their  concentration  in a few areas, led by the country’s premier global city, greater New York city, with 75 of the 170.”  New York is followed by Washington DC with 23, another sign of the growing wealth of the national capital.  Boston follows with 10, Los Angeles, 18, San Francisco (14), and Chicago (6) and then a scattering in other leading metropolitan areas.

Morrill also looked at unequal income zip codes, where income disparity was most pronounced, and poor zip codes, which often included areas with a large student population, such as Storrs, which masked thrich zip codes
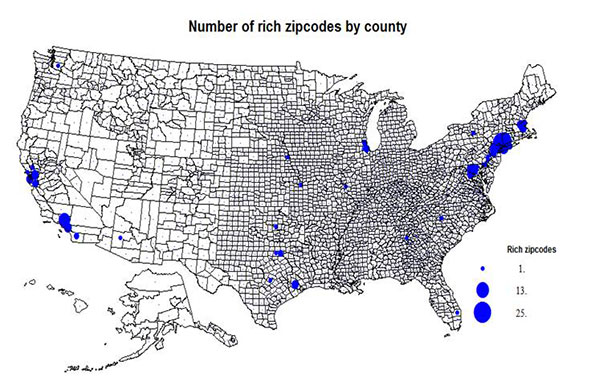
e income level of the overall population of the zip code. Among the poorest of the inner city poor areas, the data indicated, were in Los Angeles, Waterbury, CT; Portland, OR; and Youngstown and Canton, OH.

 Morrill's research focuses on political geography (voting behavior, redistricting, local governance), population/demography/settlement/migration, urban geography, and planning, and urgan transportation.  He concluded that “the zip code data provide a partial, highly localized look at the geography of inequality,” adding that “if American society continues to accept extreme income, the geography of inequality will only become not only more extreme, but more pronounced in a diverse set of locations.”

new canaan

FI-weston-sign-lamp-flag-go1-300x180

More Children in Poverty, Less State Spending For Children, Reports Reveal

The percent of children in poverty in Connecticut increased to 13.2 percent, up from 10.4 percent in the 2000 Census, according to advocacy organization Connecticut Voices for Children, which analyzed data  in the U.S. Census Bureau’s American Community Survey (ACS) covering 2008-2012.  The statewide increase in poverty among children reflects significantly increased child poverty rates in 30 cities and towns, and decreased poverty rates for children in only 12 communities.

Income disparities among Connecticut’s communities are also clearly reflected in the data.  In Hartford, for example, the percentage of children in poverty reached a state high of 45 percent and the adult poverty rate hit 33 percent, while at the other end of the spectrum, the rate in Canterbury was less than 1 percent among children and less than 3 percent among adults.

After Hartford, the percentage of children living in poverty was at its highest in the state’s urban and rural communities:  New Haven topped 37 percent, in Waterbury 34 perckids
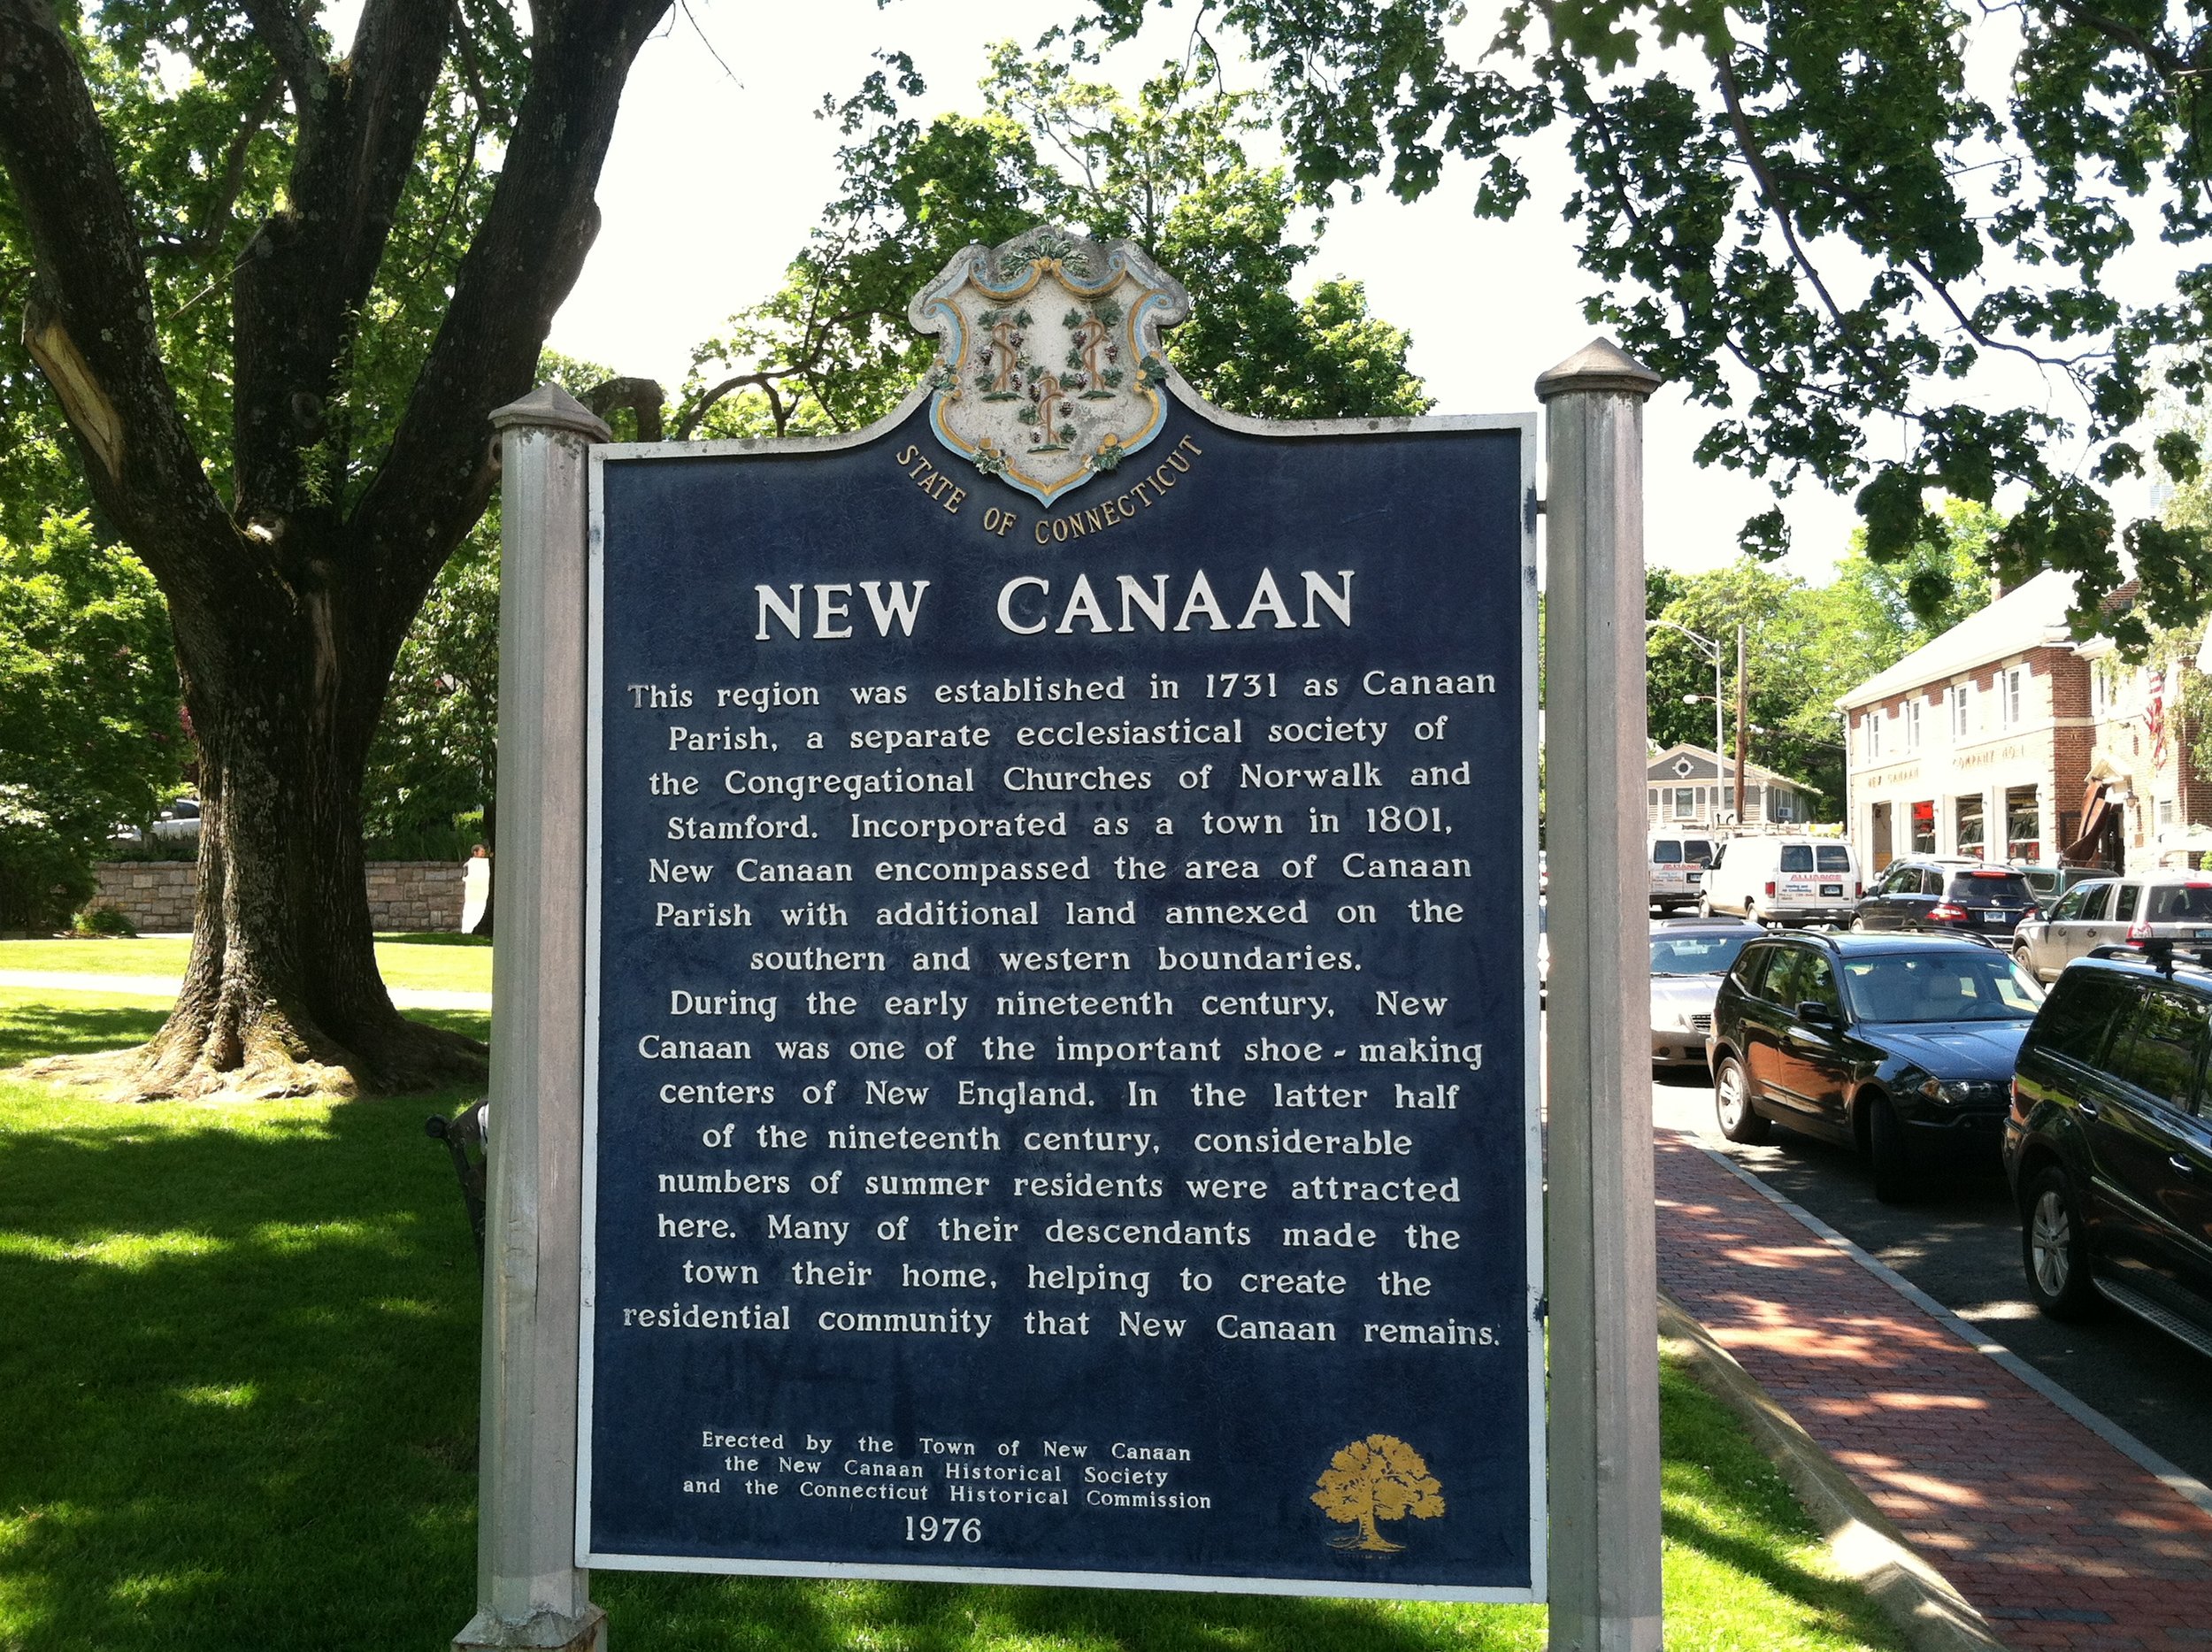
ent, New London 29 percent, Cornwall, 27 percent, Norwich 23 percent, Meriden 22 percent, East Hartford and Preston, both at 21 percent, Stamford and Kent, both at 13 percent, and Danbury 12 percent.

The following 30 towns had statistically significant increases in the percent of all children in poverty: Ansonia, Avon, Berlin, Branford, Bridgeport, Cornwall, Danbury, Darien, Derby, East Haddam, East Hartford, East Haven, Enfield, Hartford, Harwinton, Litchfield, Meriden, Middletown, New Britain, New Hartford, New Haven, Norwich, Plymouth, Preston, Stamford, Vernon, Waterbury, West Haven, Windham, and Windsor Locks.

The following 12 towns had statistically significant decreases in the percent of children in poverty: Barkhamsted, Canterbury, Columbia, Granby, Hamden, Morris, Old Lyme, Salisbury, Sharon, Thomaston, Winchester, and Woodbridge. voices logo

The percent of all Connecticut residents in poverty increased to 10.0 percent according to the ACS data, up from 7.9 percent in Census 2000 (1999 figures).  Because the ACS is based on information gathered from a sample of local residents, the "sample size" in each town can be small in any one year.  The Census Bureau, therefore, averages together five years of data to create more reliable estimates.

In another report issued early this year, it was revealed that over the past two decades, Connecticut has committed less and less of its state budget to young people, according to the Fiscal Policy Center at Connecticut Voices for Children.

The report finds that spending on the “Children’s Budget” – state government spending that directly benefits young people – has dropped from 40% of the state budget in Fiscal Year 1992 to 30% in the current budget year (FY 2014). Spending on education has fallen by about a third -- from 26% of the state budget to 19% between Fiscal Years 19American Community Survey92 and 2014. The report, “Introducing the Children’s Budget,” is available on the Connecticut Voices for Children website at www.ctvoices.org

Connecticut Voices for Children is a research-based think tank that advocates for policies that benefit the state’s children and families.  Based in New Haven, the organization advances its mission through high quality research and analysis, strategic communications, community education, and development of the next generation of advocates.

Seven Communities Earn Grants to Strengthen Downtowns

Connecticut Main Street Center (CMSC), the downtown revitalization and economic development non-profit, has selected seven organizations and municipalities to receive a total of $70,000 in  Preservation of Place grants this year.

The 2014 grants will be used to provide Connecticut communities in Bridgeport, Canton, Essex, New London, Norwalk, the Northwest corner, and Willimantic with targeted resources to increase their capacity to plan for preservation and revitalization initiatives in their downtowns and neighborhood commercial districts.

The PreserCT Main Street LOGOvation of Place grant program provides a source of funding for new initiatives that can be integrated into, and leverage, comprehensive Main Street preservation and revitalization programs. The funds are meant to be flexible to meet individual community need.

"Historic preservation and the revitalization of our Main Streets create jobs, bring vacant buildings back on the tax rolls and add value and vitality to adjacent buildings and neighborhoods," said John Simone, CMSC President & CEO. "This year's winners are taking steps to implement these types of positive changes by proactively planning for the growth and improvement of their downtowns."

The selected organizations or initiatives will receive between $5,000 and $14,500 in Preservation of Place grant funds:

  • ·         Bridgeport Downtown Special Services District, for the creation of a plan that will use open spaces to facilitate creating placemaking in downtown Bridgeport
  • ·         Town of Canton, for the development of Collinsville Village Zoning Regulations;
  • ·         Town of Essex, for a Centerbrook Visioning & Action Plan;
  • ·         New London Main Street, for an organizational and leadership development and capacity-building plan,
  • ·         Norwalk 2.0, for the Freese Park Artist Village Plan;
  • ·         Northwest CT Regional Planning Collaborative, for Active Main Street: Enlivening Village Center Public Spaces;preservation of place
  • ·         Thread City Development, Inc. (Willimantic), for an organizational and leadership development plan.

"The diversity of locations, from the Northwest Corner of Connecticut to New London, matched with the diversity of projects, from creative placemaking in urban open spaces to organizational and leadership development that will improve the management function in downtown, will allow each community to respond to their greatest current need, actively creating their direction of growth," Simone said.

Since 2008, CMSC has awarded $376,130 through the Preservation new londonof Place grant program to twenty Connecticut communities, leveraging $842,727 in local Main Street initiatives. The program receives support from the State Historic Preservation Office with funds from the Community Investment Act.

Museum Retailers Headed to Hartford for National Conference

What do Houston, Los Angeles, New Orleans, Chicago and Hartford have in common?  Each has been selected to serve as host for the Museum Store Association’s annual Retail Conference & Expo.  Hartford will have the honors in 2015, having just been selected by the association’s site selection committee for their 60th Annual event.

The four-day conference, to be held at the Connecticut Convention Center April 17-20, 2015,  is expected to bring in 900 participants downtown, representing over 500 museums, other cultural institutions, and companies with products and services of interest to the museum store industry. Officials anticipate 1,130 room nights and 360 peak nights will be booked by attendees next spring.

It is the only conference and expo specifically created for retailers at museums, historic sites, botanic gardens, aquariums, zoos, libraries and more. The annual show provides a valuable opportunity for members of the association to network, learn and source vendors and products to complement their institutional collections.

Among the 11 institutions and nine vendors that are Hartford-area members of the association are the Wadsworth Atheneum Museum of Art, Connecticut Historical Society Museum & Lmusuem logoibrary, Harriet Beecher Stowe House, New Britain Museum of American Art and Friends of Dinosaur State Park and Arboretum.

The Museum Store Association (MSA) is bringing its annual conference to the Northeast for the first time in more than a decade.  They met in Philadelphia in 2003.  Given the number of members and vendor affiliates on the East Coast - and especially in the northeast - the organization’s  leadership determined it was time to head east. Within an 11-state region in the Northeast, there are more than 200 institutions and 100 industry vendors that are members of MSA.

Stacey Stachow, President of the Board of Directors of MSA and Manager of the Wadsworth Atheneum Museum Shop, was especially pleased with the choice. “Connecticut has so much to offer with its rich cultural history, so many museums and things to do that relate to our members.”stacey

It is expected that a Hartford-based committee will help plan activities that will involve the local members of MSA. Those plans will likely include educational sessions, networking events, tours to local museums, historical sites and other institutions of interest, and the organiation’s membership meeting and silent auction.

In selecting Hartford, MSA officials cited the convenience of travel, affordability, cultural institutions in and close to the city, and Hartford’s “pedestrian-friendly” layout as factors in the selection process.  Having a 4-star hotel interconnected with a modern Convention Center was also a plus.

MSA is a nonprofit, international association organized to advance the success of museum retail professionals. By encouraging high standards of professionalism, MSA helps cultural commerce professionals better serve their organizations. MSA also is focused on helping increase awareness about museum stores as unique shopping destinations for tourists and cultural travelers. The event features hundreds of booths showcasing the unique items for museum store and MSA-represented institutional buyers.

Jama Rice, MBA, CAE, Executive Director/CEO at MSA, reflected about the site-selection for the 2015 program: “I’d attended a conference in Hartford years back, and found it to be both charming and intimate.” Ms. Rice, who joined MSA in 2013, continued, “The area offers so many advantages from a rich museum culture to close proximity to both New York and Boston, a convenience for that concentration of institutional members and vendor affiliates across the Northeast. It’s also easily accessible to those traveling from across the country or coming in from overseas.”  logo

“We are excited to host the Museum Store Association for their 60th Annual Retail Conference & Expo next April,” statenew logod Michael Costelli, General Manager for the Connecticut Convention Center. “The program will utilize much of the meeting and exhibit space at the Center and we are confident attendees will appreciate the countless cultural attractions located right here in Hartford.”

Although this year’s conference in Houston is still months away, the MSA has already begun to promote next year’s event, highlighting Hartford on the organization’s website: “As the fourth-largest city in Connecticut, Hartford is not only home to the state’s capital, but it is the birthplace of the Boys & Girls Club, the first FM station to begin broadcasting in the world and President Theodore Roosevelt’s first automobile ride. An 18-square-mile city, Hartford is home to 125,000 residents, world-class dining, international cultural attractions and award-winning entertainment venues.”

Nearly Half of States Pushing Minimum Wage Higher Than Federal Level

Gov. Malloy’s proposal for Connecticut to raise its minimum wage to $10.10 by 2017 would extend the state’s longstanding status as consistently above the federal minimum wage.  But Connecticut is far from alone in outpacing the federal government.  The current federal minimum hourly wage is $7.25.

Data from the Pew Research Center and USA Today indicates that no fewer than 21 states have set higher minimums, ranging from $7.50 in Missouri to $9.32 in Washington State. Those states collectively include 45% of the nation’s working-age (16 and over) individuals, according to 2013 data compiled by Pew.  It is expected that by thestate wage rates end of 2014, an additional nine states may be above the federal minimum, marking the first time minimum pay in most states will be above the federal level, according to the National Employment Law Project, as reported by USA Today.

Thirteen states raised their minimum wage on January 1, 2014, including Connecticut.  On January 1, Connecticut's minimum wage moved from $8.25 to $8.70, the first of two scheduled increases in the state’s minimum hourly wage. A second increase is set to follow on January 1, 2015, bringing the state's minimum wage up to $9.00 per hour, based on legislation approved last year.   Malloy’s newly proposed three-year incremental increases would continue to bump up the hourly minimum through 2017.

Last February, a Pew Research Center survey found that 71% of people favored an increase in the federal minimum to $9.00/hour from $7.25. USA Today has reported that as many as 11 states and Washington, D.C., are expected to consider increases in 2014.

Adjusted for inflation, the federal minimum wage peaked in 1968 at $8.56 (in 2012 dollars), according to Pew researchers. Since it was last raised in 2009, tNewMinimumWageDistributiono the current $7.25/hour, the federal minimum has lost about 5.8% of its purchasing power to inflation, Pew points out.

Just over half (50.6%) of the 3.55 million U.S. workers who were at or below the federal minimum in 2012 were ages 16 to 24; an additional 20.3% were ages 25 to 34.  Pew indicated that both shares have stayed more or less constant over the past decade. The 3.55 million represents about 2.8% of all wage and salary workers.

An estimated 70,000 to 90,000 workers out of Connecticut’s total workforce of 1.7 million earn the minimum wage. It has been reported that a Connecticut resident working full time this year at minimum wage will make $18,096.  

The Bureau of Labor Statistics, which tracks the federal and state minimum wages, indicates that in 2000 the federal minimum was $5.15 and Connecticut’s was $6.15.  A generation ago, in 1972, the federal minimum wage was $1.65; Connecticut was at $1.85.

2014 increases

Number of Brewery Permits Nearly Doubles in CT in Past Five Years

The number of brewery permits in Connecticut has nearly doubled during the past five years, from 19 in 2008 to 36 in 2013, reflecting the rapid growth in the state – and nationwide – in the craft brewing industry.

Connecticut ranked #29 in the nation, between Georgia and New Jersey, in the state-by-state rankings, compiled by Bloomberg.com using data fbee brandsrom the Beer Institute and the Alcohol and Tobacco tax and Trade Bureau.  There were 3,699 permitted breweries in the United States last year, about 34 percent more than the previous year.

California led the nation with 508 brewery permits, followed by Washington State with 251, Colorado with 217, Oregon with 208 and Michigan with 188.  Rounding out the top ten were Pennsylvania (176), New York (172), Wisconsin (147), Texas (117), North Carolina (114) and Illinois and Ohio, each with 112 permitted breweries.  Every state in the nation saw an increase from 2012 to 2013.

According to the data, Connecticut had 19 permitted breweries in 2008 and 22 in 2012.  That number jumped to 36 last year.  In comparison to other states, Connecticut’s ranking dropped from 19th in 2012 to 29th in 2013, even as the number of permitted breweries increased by more than 50 percent.

 With 19 breweries and 16 in planning, according to the Brewers Association, Connecticut's economy and craft brewing industry could see tens of thousands of dollars of reinvestment.  In timage004.jpg
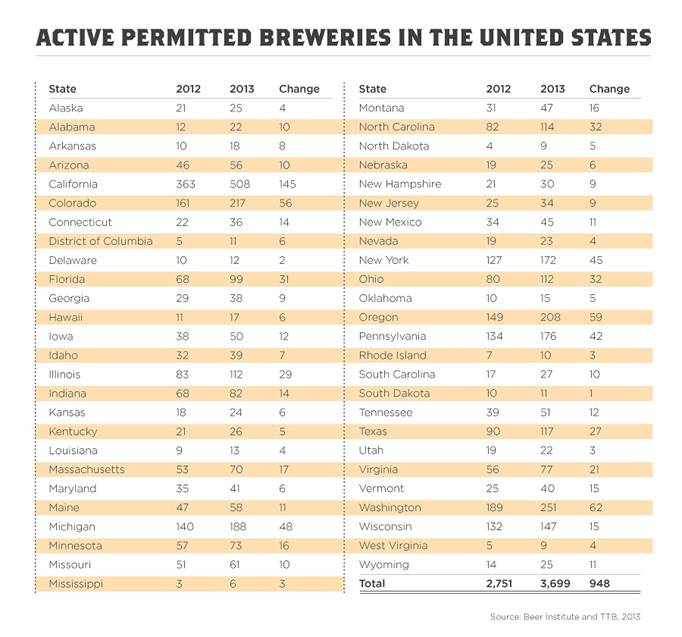
he comparative survey, permitted breweries refer to manufacturers that have completed the appropriate paperwork and obtained the necessary permits to operate, though they may not be fully operational yet, according to Bloomberg.com .

Among our neighboring states, between 2008 and 2013, Massachusetts increased from 41 to 70 brewery permits, New York from 72 to 173, and Rhode Island, which ranked #48, from 5 to 10.   North Dakota, which had one permitted brewery in 2008, now has nine, moving from #50 to #49 in the nation.

The U.S. Department of Justice Bureau of Alcohol, Tobacco & Firearms (www.atf.gov) requires retailers and manufacturers of alcohol (i.e. brew pubs) to register. The Bureau also regulates the operation of distilleries, wineries, and breweries as well as, importers and wholesalers in the industry. In addition, the Liquor Control Division of the  Connecticut Department of Consumer Protection requires a liquor permit.

The state’s tourism website, “Still Revolutionary,” suggests that “Whether you’re looking for a relaxing Sunday afternoon with friends or a longer vacation with a significant other, take a few days to explore the Connecticut Beer Trail.”

The site states unequivocally that “Connecticut is home to some of the best breweries in the country!  The Connecticut Beer Trail spotlights the high quality and creative diversity of fresh, hand-crafted, locally-brewed beer, linking together some of the best breweries in the nation.”

The Connecticut Beer Trail website, www.ctbeertrail.net, lists:

Other local brands included are:

Additionally, a number of breweries are in an early phase of development, according to the website:

CTBeerTrail.net was launched in 2010 by Byron Turner, according to the website ctbeerwine.com, to create a local craft beer social media community that was well-timed with Connecticut’s legislative push for a “Connecticut Brewery Trail.”  Gov. Malloy signed Senate Bill No. 464 into law on July 13, 2011, establishing a Connecticut Beer Trail by allowing the Department of Transportation to permit directional and other official signs or notices about facilities where Connecticut beer is made or sold, including signs or notices containing the words “Connecticut Brewery Trail”.  The website reports that as of December 2013, such signs have yet to be posted.     (Chart: Washington Post)

Soda Tax Won't Hurt Job Prospects, Tobacco Tax Offers Preview, New Studies Find

As the Connecticut legislature considers a proposal to implement a 2 percent tax on sodas, proposed by Senate Majority Leader Martin Looney at the suggestion of New Haven Mayor and former state senator Toni Harp, two new academic studies challenge the beverage industry’s view that state and local taxes on sugary drinks will hurt employment, and offer suggestions to policy makers based on the tobacco tax experience.

Harp has said the soda tax would discourage consumption of the sugary beverages – part of her campaign to combat obesity - and bring in public health logoan estimated $144 million in revenue for the state each year. It would tax all beverages “high in calories or sugar” by two percent, but does not specify how many calories or grams of sugar would trigger the tax.

The studies, appearing in the February and March issues of the American Journal of Public Health, argue, in one case, that claims of employment losses are off base because they focus only on the effects within the industry, ignoring the economic activity that comes with people substituting lower-priced goods for more expensive products as wellsoda as new spending from tax revenues.  The other study says that tobacco taxes offer a how-to road map for policy makers.

The study to be published in March, led by Jennifer L. Pomeranz, JD, MPH, while at the Yale Rudd Center for Food Policy and Obesity at Yale University, uses as its premise that “excise taxes on sugary beverages have been proposed as a method to replicate the public health success of tobacco control and to generate revenue.”

Sugary Beverage Tax Policy: Lessons Learned from Tobacco indicates that “as policymakers increase efforts to pass sugary beverage taxes, they can anticipate that manufacturers will emulate the strategies employed by tobacco companies in their attempts to counteract the impact of such taxes.”  Pomeranz suggests that “policymakers should therefore consider two complementary laws—minimum price laws and prohibitions on coupons and discounting—to accomplish the intended price increase.”

Researchers at the University of Illinois, in a just-published study in the February issue of American Journal of Public Health, found that a 20 percent increase on the price of sugar-sweetened beverages would have an overall positive impact on the labor market.

The American Beverage Association has traditionally argued that manufacturers, distributors and small business owners, particularly grocers and convenience store proprietors, would suffer were soda taxes to be imposed, but the study says that’s not likely.

In recent years, proposals to tax those beverages fell short in California, Vermont, Hawaii, Massachusetts, Mississippi, New York and Rhode Island, Governing magazine reported.  In Maine voters passed a soda tax of 42 cents per gallon in 2008 but repealed it two years later amid a major lobbying effort from the American Beverage Association. Voters in Washington state similarly reversed their legislature in 2010.  As of the end of state legislative sessions in 2011, Governing reported, only four states had taxes specifically targeting sugary beverages, including Arkansas, Tennessee, Virginia, and West Virginia, according to the Tax Foundation.

In the study publstrawished this month, researchers ran a simulation of the impact of 20-percent soda tax in Illinois and California—selected for regional differences—and found slight employment increases would occur, but the net effect would be close to nothing. They found that people choose to spend their money on other things, not to forego spending entirely, and that employment gains in other sectors of the economy far outweigh the job losses for soda makers, National Journal reported.

“We find there are losses in the beverage industry, but when you’re talking about the whole economy suffering job losses, you can’t just talk about your own industry,” Lisa Powell, health policy professor at the University of Illinois at Chicago and the study’s lead author, told National Journal. “Using job loss as a scare tactic for the economy overall is misleading.”

Public health advocates have warned of a link between added sugar and illnesses ranging  from Type 2 diabetes and obesity to heart disease and osteoporosis. The caloric intake of sugary beverages increased dramatically from 1988 to the mid 2000s, though consumption has dropped across all age groups in recent years, Governing reported, with some citing the increased public attraction to teas and other beverages.  Like Harp and Looney in Connecticut, some elected officials around the country have proposed raising taxes on sugary drinks in order to reduce consumption.  The New Haven Register reported that Harp has pointed out that revenue from the cigarette tax has decreased, showing that the effectiveness of a tax in reducing consumption.Jennifer-Pomeranz

Pomeranz is a public health law and policy researcher focusing on marketing, labeling and youth access issues related to food and beverages, over-the-counter diet drugs, and dietary supplements, publishing on topics including discrimination, the First Amendment, public health preemption, and innovative regulatory strategies to address public health problems such as obesity. She is Assistant Professor at the Center for Obesity Research and Education in the Department of Public Health and at the College of Health Professionals and Social Work at Temple University, having served previously as Director of Legal Initiatives at the Yale Rudd Center for Food Policy & Obesity.  She is currently the Policy Chair of the Health Law Section of the American Public Health Association and the official liaison between the American Academy of Pediatrics and the American Public Health Association.lisa powell 2

Lisa Powell is a Senior Research Scientist in the Institute for Health Research and Policy and Research Professor in the Department of Economics at the University of Illinois at Chicago. She has extensive experience as an applied micro-economist in the empirical analysis of the effects of public policy on a series of behavioral outcomes.

A 2011 study by the Yale Rudd Center for Food Policy & Obesity found that young people are being exposed to a massive amount of marketing for sugary drinks, such as full-calorie soda, sports drinks, energy drinks, and fruit drinks.  The study, described as the most comprehensive and science-based assessment of sugary drink nutrition and marketing ever conducted, found that companies were marketing sugary drinks targeting young people, especially black and Hispanic youth.