Charitable Giving in CT Not Keeping Pace with U.S., Report Finds

The latest report from the Connecticut Council of Philanthropy (CCP), which highlights philanthropic giving in Connecticut shows that as giving across the U.S. has increased, the opposite is true of Connecticut, even as individual giving – which makes up the lion’s share of giving – has increased. The report, which highlights calendar year 2014 and the years leading up to it, reveals that while total giving in the U.S. increased from 2013 to 2014, total giving in Connecticut dropped from $4.66 billion to $4.51 billion. Over the five years through 2014, individual giving by Connecticut taxpayers who itemized rose 14 percent, less than the increase nationally of 25 percent.  More than three-quarters of giving in Connecticut is by individuals.

In 2014, Connecticut was ranked number one in per capita income by state and 45th in charitable giving.  All six New England states rank at the bottom in per capita giving, while Southern states rank near the top.  Yet the proportion of tax returns reporting contributions in 2014 at 34.5 percent was considerably higher than the national average of 24.5 percent, the report indicated.

The annual report, Giving in Connecticut, looks at charitable giving by Connecticut grant makers and residents, including: individual giving through reported contributions, bequests made through estate giving, and foundation giving. Giving in Connecticut uses data from the IRS Statistics of income Division, the Foundation Center, and self-reported data gathered by CCP.

The report, published this month, found that:

  • Giving in Connecticut from all sources at $4.51 billion was down 3.2 percent from 2013, due primarily to a drop in bequests.
  • The giving breakdown: $3.39 billion from individuals; $1.02 billion from foundations; $.09 billion from bequests
  • Giving by individuals was up 2.8 percent.
  • Giving by all foundations was up 2.1 percent.
  • Giving via bequests was down 74 percent after being up the previous year by 76 percent.
  • Giving by individuals and bequests combined at $3.48 billion amounted to 77 percent of all giving.

The report indicated that giving by foundations saw most grants going to Education and Health. Giving by foundations is greatest in Fairfield County where 56 percent of Connecticut foundations are based. They gave $747 million to charities, representing 73 percent of total foundation grant making.

Religion is the largest single category of recipient type of charity across the U.S., at 33 percent.  Education ranks second at 15 percent.

The 20-page report also found that in 2012, individual giving in Connecticut spiked, apparently in response to Superstorm Sandy and the tragedy at the Sandy Hook elementary school in Newtown.

Connecticut has 1,425 Private Foundations, 79 of which are Operating Foundations, 59 are Corporate Foundations and 20 are Community Foundations, according to the report. Community Foundations assets showed strong growth of 41 percent from 2010 to 2014, from $1.37 billion to $1.92 billion. Connecticut Corporate Foundation giving remained steady during the five year period while private foundation giving climbed.  

The top five foundations, by giving, were the Boehringer Ingelheim Cares Foundation, Dalio Foundation, GE Foundation, The Zoom Foundation, and the Steven & Alexandra M. Cohen Foundation.  Rounding out the top 12 in 2014 were Hartford Foundation for Public Giving, Seedlings Foundation, Newman’s Own Foundation, The Community Foundation for Greater New Haven, Smith Richardson Foundation, Connecticut Bar Foundation and Aetna Foundation.

The Connecticut Council for Philanthropy is an association of grantmakers committed to promoting philanthropy for the public good.


Breast Cancer is Latest Cause to Grow Interest Through CT License Plate

Connecticut, with more than 50 special license plates featuring everything from animals to war survivors, is headed toward adding another choice for state residents to purchase. Organizers of Seymour Pink, the grassroots initiative launched in 2009 to raise money and awareness for breast cancer, is looking to have a specialty license plate produced to show support for the cause, the New Haven Registered reported this week. license-plates-ct

State law allows the Department of Motor Vehicles to issue of special background plates on behalf of non-profit organizations. The organization must be non-profit, must submit a copy of the organization's charter or by-laws, provide a letter of good standing from the State of Connecticut Secretary of State’s Office (if required) and supply any Internal Revenue Service ruling on their non-profit tax exemption status.

The logo production and cost incurred will be the responsibility of the organization. The logo prototype design, preferred in PDF format, must be submitted to the DMV. The logo can be no larger than 2 inches wide and 3.5 inches high. DMV has final approval on all the plate and logo designs.

A liaison for the organization must be appointed. This individual will be responsible for all communications with the DMV as well as certifying and authenticating (by signature) each member’s application, submitting the logo design to DMV for approval, submitting 400 applications with the required fee prior to the manufacturing of the special background plates, and submitting a Special Interest Plate disclaimer.

Seymour Pink Founder Mary Deming told the Register that 100 paid applications have been received from people who want to purchase a “Seymour Pink” license plate for their cars.  The state Department of Motor Vehicles won’t begin production on the plate until Seymour Pink secures at least 400 paid applications, Deming said, indicating that Seymour Pink has set a tentative deadline of Jan. 15 to reach the needed 400 paid applications, the Register reported.

Many organizations in Connecticut offer license plates to their members and the general public.  General categories include animals, colleges, environment, organizations, police and fire, cities and towns, and recreation.

Organization vanity plates include Amistad, Benevolent & Protective Order of the Elks, IUOE Local 478, Grand Lodge of Connecticut, Knights of Columbus, Olympic Spirit, P.T. Barnum Foundation Inc., Preserving Our Past CT Trust for Historic Preservation, Red Sox Foundation, Lions Eye Research Foundation, Special Olympics, Federated Garden Clubs, Fidelco Guide Dog Foundation, Keep Kids Safe, New England Air Museum and the U.S.S. Connecticut Commissioning Committee.

All fees established and collected pursuant to the United We Stand plate (except moneys designated for the administrative costs of the DMV) shall be deposited in the United We Stand commemorative account.  Funds are directed to the United States Department of State Rewards for Justice program and is used solely to apprehend terrorists and bring them to justice. The account will also be distributed to the Secretary of the Office of Policy and Management for the purpose of providing financial support and assistance to the former spouses and dependents of persons killed as a result of the acts of terrorism committed on September 11, 2001.

When individuals purchase a Keep Kids Safe plate, a portion of the fee goes to the Keep Kids Safe Fund, which “makes many worthy projects happen for youngsters.”  The fund awards grants to schools, hospitals, municipalities and other non-profit organizations working to make all Connecticut children safer from severe and preventable injuries, according to the DMV website.

In most cases, remake of a current plate is $70; a new vanity plate is $139, a new series plate is $50.  For others, including the UConn Huskies plate, the price tag is somewhat different.  Off-the-shelf license plates cost $55, remake of a current plate is $75, a new vanity plate costs $144, according to the DMV website.

The Support Our Troops plate sends a portion of the fee to provide funding for programs to assist Connecticut troops, their families and veterans. When you buy a Red Sox plate, a portion of the fees support and help fund academic scholarship programs in Connecticut.

Also included are 17 varieties of military specialty plates, including Disabled American Veteran, Gold Star Family, Iwo Jima Survivor, Korean War Veterans Association, Marine Corps League, Laos Veterans of America, Military Order of the Purple Heart, Pearl Harbor 1941, U.S. Submarine Veteran, National Guard Association of Connecticut, First Company Governor’s Foot Guard, First Company Governor’s Horse Guard,

Colleges with designated plates include Central Connecticut State University, Penn State Alumni, University of Hartford, University of Connecticut, and University of New Haven.  Cities with available plates include Meriden, Norwich, and Stafford.

Organizations interested in launching a new special plate, should contact the DMV Special Plate Unit at (860) 263-5154 for further information.


CT’s Mortality Rate from Drug Poisoning is 11th Highest in US; Was 6th Lowest A Decade Ago

Connecticut’s mortality rate from firearms is less than half the national average, the state’s homicide rate is slightly above half the national average, but the rate of drug poisoning deaths exceeds the national average. Data from the Centers for Disease Control and Prevention (CDC) indicate that Connecticut’s mortality rate from drug poisoning was 17.6 per 100,000 population, with 623 deaths in the state in 2014, the 19th highest rate in the nation.  The U.S. rate that year was 14.7, with 47,055 fatalities.  Last year, Connecticut’s mortality rate from drug poisoning climbed to 22.1, which was the 11th highest rate in the nation, with 800 deaths. 

The states with the highest drug poisoning mortality rates in the nation in 2015 were West Virginia, New Hampshire, Kentucky, Ohio, Rhode Island, Pennsylvania, Massachusetts, New Mexico, Utah, Tennessee and Connecticut.  The lowest rates were in Nebraska, South Dakota, North Dakota, Texas and Iowa.

The CDC reported this month that opioids—prescription and illicit—are the main driver of drug overdose deaths. Opioids were involved in 33,091 deaths in 2015, and opioid overdoses have quadrupled since 1999.

In 2015, according to the CDC, significant increases in drug overdose death rates from 2014 to 2015 were primarily seen in the Northeast and South Census Regions. States with statistically significant increases in drug overdose death rates from 2014 to 2015 included Connecticut, Florida, Illinois, Kentucky, Louisiana, Maine, Maryland, Massachusetts, Michigan, New Hampshire, New Jersey, New York, North Carolina, Ohio, Pennsylvania, Rhode Island, Tennessee, Washington, and West Virginia.

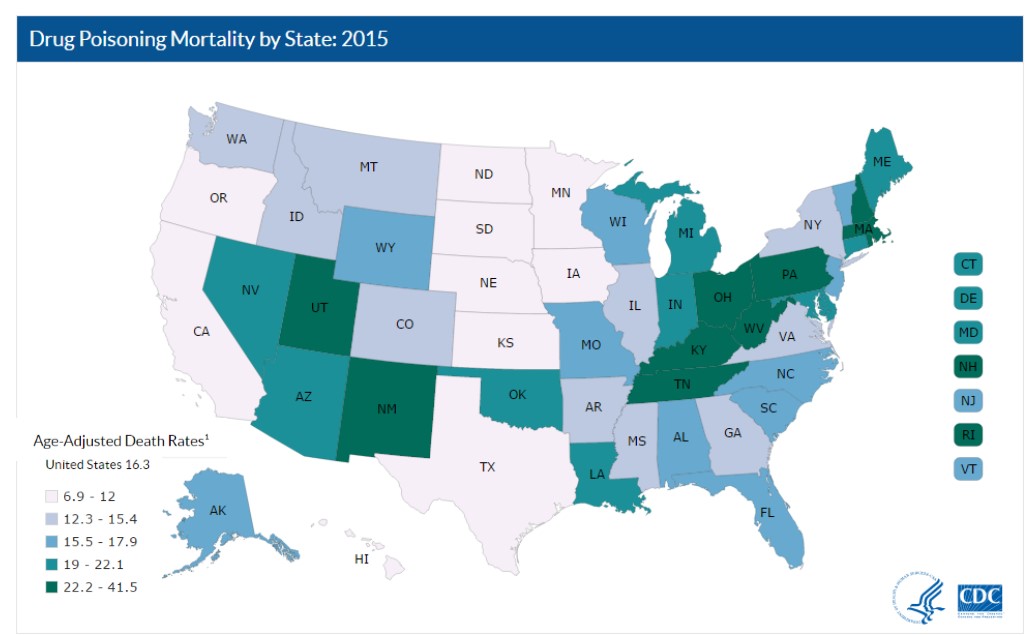
The five states with the highest rates of death due to drug overdose were West Virginia (41.5 per 100,000), New Hampshire (34.3 per 100,000), Kentucky (29.9 per 100,000), Ohio (29.9 per 100,000), and Rhode Island (28.2 per 100,000).

The increase in drug overdose deaths in Connecticut from 2014 to 2015 was 25.2 percent, the fourth highest in the nation among states that had a statistically significant increase.  Only Massachusetts, New Hampshire and Maine had larger increases.

Among the 28 states meeting inclusion criteria for state-level analyses, 16 (57.1%) experienced increases in death rates involving synthetic opioids other than methadone, and 11 (39.3%) experienced increases in heroin death rates from 2014 to 2015, the CDC reported.

The largest absolute rate change in deaths from synthetic opioids other than methadone occurred in Massachusetts, New Hampshire, Ohio, Rhode Island and West Virginia. The largest percentage increases in rates occurred in New York (135.7%), Connecticut (125.9%) and Illinois (120%).

Connecticut, Massachusetts, Ohio, and West Virginia experienced the largest absolute rate changes in heroin deaths, while the largest percentage increases in rates occurred in South Carolina (57.1%), North Carolina (46.4%), and Tennessee (43.5).

Connecticut announced a detailed opiate response initiative this fall.  The Connecticut Opioid REsponse Initiative (CORE) is a strategic plan from Yale experts in response to the state’s opioid and overdose epidemics. It recommends: 1) expanding access to effective, medication-based treatment for substance use disorders; 2) improving transitions within the treatment domain; 3) increasing the availability of naloxone — the antidote to reverse an opioid overdose — and; 4) decreasing the over-prescribing of opioid at high doses or in combination with sedatives.

The CDC said “there is an urgent need for a multifaceted, collaborative public health and law enforcement approach to the opioid epidemic;” the Drug Enforcement Administration referred to prescription drugs, heroin, and fentanyl as the most significant drug-related threats to the United States, the CDC reported.


Connecticut Opioid REsponse Initiative (CORE) news conference, 10/6/16

https://youtu.be/fqw-AXvsL_8

Northeast Sees Relatively Strong International Migration Amidst Overall Weak Population Growth

New data from the U.S. Census indicates that population growth and domestic migration patterns have continued to move away from the East and the Midwest to the South and West, at accelerated rates, the website newgeography is reporting. Equally important, according to the site, pre-Great Recession interstate mobility rates have been restored.  The Census population estimates for the nation, states and the District of Columbia indicate a population increase for the South of 7.7 million between 2010 and 2016. The West gained 4.7 million. By contrast, the Midwest grew 1.1 million, while the East, including Connecticut, was even lower, at 900,000.

Combined, the South and West accounted for 87 percent of the national growth, the website’s analysis of the Census data indicated. In 2011, the South and West captured 82 percent of the national growth. By 2016, the South and West had risen to 94 percent of the national population increase. The South, alone had 57 percent of the growth, up from 52 percent in 2011. The West also had a strong gain, from 31 percent in 2011 to 36 percent in 2016.  The growth leaders:

  • Texas has led the nation in total population growth. Total population growth includes the natural change (births minus deaths), international migration and net domestic migration. Texas added 2.7 million residents, a 10.8 percent increase compared to its 2010 population. This is more than double the national rate of 4.7 percent.
  • California was well behind, with a gain of 2.0 million, despite having started the decade with a 50 percent higher population. California’s growth rate was 5.3 percent.
  • Florida added the third largest number of new residents, at 1.8 million, for a 9.6 percent growth rate from 2010.

Three states suffered population losses over the period. Illinois lost 30,000 residents and West Virginia lost 20,000. Vermont lost 1,000 and was joined by New England neighbors Maine, New Hampshire, Connecticut and Rhode Island in the bottom 10, with slim increases in overall population.

International migration was a bright spot for the Northeast, which along with the South were the two leading regions, followed by the West and Midwest.

The East and Midwest had a near monopoly on the bottom 10 in net domestic migration. New York lost 867,000 net domestic migrants, while Illinois lost 540,000. California’s loss was 383,000. New Jersey lost 336,000 and Michigan 216,000. Connecticut, Pennsylvania, and Ohio lost between 100,000 and 200,000, while Maryland and Massachusetts lost between 70,000 and 100,000.

In 2016, there were 825,000 interstate moves, according to the data outlined by newgeography, which is more than double the post-2000 low of 411,000 in 2011. The 2016 moves exceeded the 2001 to 2009 average by more than 10 percent

PERSPECTIVE: Obscuring What Made America Prosper

by Jacob S. Hacker Distrust in public institutions is a broad cultural trend. It is whipped up in popular entertainment and reinforced by a news media that sometimes seems to relish treating every person and organization as equally venal. Distrust in government, we have seen, is also, however, spread systematically, deliberately, and relentlessly—by GOP leaders who gain politically by “destroying the village to save it” and by powerful interests that have profited from the confusion and disaffection that widespread distrust feeds.

Consider the biggest threat facing our planet: global warming. Sowing doubt about climate change has proved a huge and hugely successful enterprise. Indeed, the fossil fuel industry deserves some special prize for chutzpah: In its propaganda, the bad guys aren’t carbon-emitting corporations trying to preserve trillions in dirty assets but instead climate scientists supposedly ginning up a false crisis to get research grants.

The modern GOP has joined the industry in its endorsement of whatever egregious defense seems most effective at the moment. Although the first lines of resistance (“global warming isn’t happening”; “it is, but for natural reasons”) have more or less crumbled, and “I’m not a scientist” doesn’t seem likely to work for long, either, there are plenty of additional trenches to retreat to: “Reform won’t work.” “It will be too expensive.” “It is pointless absent efforts by other countries.” “We want reform, just not this one —or the next one.” In the meantime, the fossil fuel industry continues to book huge profits and atmospheric carbon dioxide levels continue to rise.

The marketplace of ideas is of great value. But just as in the actual marketplace, we all need help deciding which products are reliable and which are not. Consumer Reports is available for car buyers—whose decisions are a lot simpler than the typical policy choice. Yet, in our hyperpolarized political world, institutions recognized as credible sources of independent knowledge continue to lose ground.

Take the news media. As much as the decline of broadcast and print news has hurt independent journalism, the media remains the main mechanism through which people learn about the broader world. Too often, however, reporters structure stories to create controversy or convey catastrophe…The basic story of this book—that governments and markets, working in tandem, have steadily increased human welfare (if, of late, far too gradually)—offers no hook that will excite reporters.

What’s more, even when journalists cover important policy debates, they tend to fall into the trap of “he said, she said” reporting on political conflict. Simply recounting the claims of both “sides” in a debate—each debate having exactly two—imparts a potentially misleading message of unresolved controversy and false equivalence. When the weight of the evidence is in fact on one side, the “he said, she said” approach provides journalists with a safe posture of neutrality that, in practice, advances particular agendas and makes it harder for readers to understand events…

Our discourse about government has become dangerously lopsided. The hostility of the right is unceasing and mostly unanswered. Eloquent leaders defend individual programs, but too rarely defend the vital need for effective governance. Politicians facing electoral pressures participate in a spiral of silence. Chastened by government’s low standing, they reinforce rather than challenge it…

Rhetoric is only one part of problem. Cowed policymakers also design programs that send much the same message.

The political scientist Suzanne Mettler has documented the increasing tendency to “submerge” policies so the role of government is hidden from those who receive benefits. These subterranean policies include tax breaks for private savings for education and retirement, as well as reliance on private companies and contractors even where these proxies are less efficient than public provision. These submerged benefits are usually bad policies, but they are even worse politics. Voters who don’t recognize government are not likely to appreciate what government does. Nor are they likely to form an accurate picture of government’s role, seeing only its visible redistribution but not the vast numbers of ways in which it enables prosperity…

Consider the most maligned policy of recent years: the Affordable Care Act. Even as the law has expanded health coverage while moderating costs, critics continue to spew out disinformation and insist their direst predictions have come true (and get a respectable hearing from the news media). They claim millions are losing good insurance despite a historic expansion of coverage. They claim costs are skyrocketing despite a historic slowdown of medical inflation...

Given all this, it’s no surprise that Americans know strikingly little about the most important social policy breakthrough of the past half-century. Asked how the actual cost of the law compares with estimates prior to enactment, roughly 40 percent admitted they had no idea. Another 40 percent thought costs were higher than predicted. Only 8 percent knew that costs were substantially lower than anticipated.

Here, as in so many areas, voters have a limited understanding of government performance, receive scant guidance from the media, and are encouraged by a barrage of negativity to assume the worst. In the 2014 election campaign, anti-ACA ads outnumbered favorable ones by a ratio of 13 to 1…

A government that effectively promotes human flourishing is a government worth fighting for. More than ever, the problems we face demand a sustained and principled defense of a vital proposition: The government that governs best needs to govern quite a bit. Americans must remember what has made America prosper.

__________________________

Excerpt from AMERICAN AMNESIA by Jacob S. Hacker and Paul Pierson.  Copyright © 2016 by Jacob S. Hacker and Paul Pierson. Reprinted by permission of Simon & Schuster, Inc, NY. 

Hacker was the keynote speaker at the Connecticut Data Collaborative conference, “Counting What Matters: Better Data for Better Policy in Connecticut,” on Dec. 9.  He is the Stanley B. Resor Professor of Political Science and Director of the Institution for Social and Policy Studies at Yale University, and a member of the Steering Committee of the Scholars Strategy Network, research to improve policy and strengthen democracy.

Traffic Deaths at 4-Year High in Connecticut

The Connecticut Crash Data Repository (CTCDR) reports that the number of traffic deaths in Connecticut through December 22 in 2016 is the highest in the past four years.crash-logo The CTCDR is a web tool designed to provide access to select crash information collected by state and local police. This data repository enables users to query, analyze and print/export the data for research and informational purposes. The CTCDR is comprised of crash data from two separate sources; the Department of Public Safety (DPS) and the Connecticut Department of Transportation (CTDOT).

The latest data reports a total of 301 traffic deaths in the state this year, compared with 273 through the same date in 2015; 245 in 2014 and 278 in 2013, all through December 22. It is the second consecutive annual increase in the number of traffic fatalities.

stats2The purpose of the CTCDR is to provide members of the traffic-safety community with timely, accurate, complete and uniform crash data. The CTCDR allows for complex queries of both datasets such as, by date, route, route class, collision type, injury severity, etc.

For further analysis, this data can be summarized by user-defined categories to help identify trends or patterns in the crash data. The site is maintained by the University of Connecticut.

Lead Poisoning Is A Problem for Connecticut Children, National Study Reveals

A Reuters news service examination of lead testing results across the country found almost 3,000 areas with poisoning rates far higher than in Flint, Michigan, which was the focus of national attention this year for its dangerously tainted water supply. reuters-investigates-logoThe review and analysis found at least seven areas in Connecticut, based on zip code geography, where the percentage of children found to have elevated lead levels exceeded – more than doubled – the percentage in Flint.

The Centers for Disease Control and Prevention (CDC) estimates that nationwide, around 2.5 percent of children ages 0-6 have an elevated lead level, defined as 5 micrograms/deciliter or higher. Among small children tested in Flint, Michigan during the peak of that city’s lead contamination crisis, 5 percent had elevated levels, or double the average.sign

In many neighborhoods – census tracts or zip code areas – across the country, a far higher rate of children have tested high in recent years.  The zip codes in Connecticut with elevated lead levels in more than 5 percent of children tested include more than a dozen neighborhoods and communities scattered across the state, with the highest levels  in the towns of Canaan and Sharon, and the cities of Bridgeport, New Haven, and Waterbury.

mapThe State Department of Public Health website indicates that “childhood lead poisoning is the most common pediatric public health problem, yet it is entirely preventable. Once a child has been poisoned, the impairment it may cause is irreversible. Lead harms children’s nervous systems and is associated with reduced IQ, behavioral problems, and learning disabilities.”

Since the 1970s, U.S. efforts to eradicate childhood lead poisoning have made what Reuters describes as “remarkable progress,” while pointing out that “the advances have been uneven.”  Legacy lead – in paint, plumbing, yards, well-water or even playgrounds – means that kids in many neighborhoods remain at a disproportionately high risk of poisoning, the news service report explained.

The news service conducted a nationwide analysis of childhood blood lead testing data at the neighborhood level. Census tract or zip code level data reflecting the local prevalence of elevated lead tests was obtained from 21 states, including Connecticut.  The highest prevalence was found in:

Zip Code                              Tested Children /Elevated Results

06031 Canaan                    107 / 15.89%

06608 Bridgeport            8,602 / 13.32%

06511 New Haven            15,731/12.88%

06519 New Haven            8,318 / 11.95%

06607 Bridgeport             4,079/10.9%

06710 Waterbury             6,133/ 10.48%

06069    Sharon                  137 /10.22%

Across the country, Reuters found nearly 3,000 areas with recently recorded lead poisoning rates at least double those in Flint during the peak of that city’s contamination crisis. And more than 1,100 of these communities had a rate of elevated blood tests at least four times higher.

Reuters reports that zip codes have average populations of 7,500. In each area, a relatively small number of children are screened for lead poisoninglead_free_kids_logo_web each year, the report indicated.

The poisoned places stretch from Warren, Pennsylvania, a town on the Allegheny River where 36 percent of children tested had high lead levels, to a zip code on Goat Island, Texas, where a quarter of tests showed poisoning, the Reuters analysis indicated. In some pockets of Baltimore, Cleveland and Philadelphia, where lead poisoning has spanned generations, the rate of elevated tests over the last decade was 40 to 50 percent.

“I hope this data spurs questions from the public to community leaders who can make changes,” said epidemiologist Robert Walker, co-chair of the CDC’s Lead Content Work Group, which analyzes lead poisoning nationwide. “I would think that it would turn some heads.”

The findings, Walker told Reuters, will help inform the public about risks in their own neighborhoods and allow health officials to seek lead abatement grants in the most dangerous spots.

Congress recently directed $170 million in aid to Flint - 10 times the CDC’s budget for assisting states with lead poisoning this year, Reuters reported.

Efforts Forge Awareness From Tragedy, As CT Nonprofit Stresses Fire Safety

Jeff Block founded One Innocent Life, a Connecticut-based nonprofit organization, 18 months ago while battling for a new state law to improve Connecticut fire safety standards. He has been campaigning for fire safety in Connecticut homes since 2012, when his daughter, Eva, of Woodbridge, and two friends, died in a fire in their off-campus housing at Marist College in upstate New York on January 21st.  Approximately 66 percent of students attending college in the U.S. live in off-campus housing, according to the Center for Campus Fire Safety Student Committee.

His efforts led to legislation in Connecticut, but One Innocent Life is continuing to advocate for greater awareness, in Connecticut and beyond, on campuses and in local communities.bd76ed_cc7948303b504bd8830d8774cae99184

According to the National Fire Protection Association, U.S. fire departments responded to an estimated annual average of 3,870 structure fires in dormitories, fraternities, sororities, and barracks between 2009 and 2013.  From 2000 - 2015, 89 fires that killed 126 people have occurred on a college campus, in Greek housing or in off-campus housing within three miles of the campus. Of these, 76 off-campus fires caused 107 deaths, while 7 on-campus building or residence hall fires claimed 9 victims and 6 fires in Greek housing took the lives of 10 people.

Public Act 15-5, approved by the Connecticut legislature in the June 2015 Special Session, took effect on October 1, 2015.  The law requires landlords to include a notice in each dwelling unit's lease disclosing whether the unit has a working fire sprinkler system. If a unit has a working system, the lease must also include a notice indicating the date of its last maintenance and inspection. Both notices must be printed in a uniform font of at least 12-point, boldface type.

Under the state law, a “fire sprinkler system” is a system of piping and appurtenances designed and installed according to generally accepted standards so that heat from a fire automatically causes water to discharge over the area, extinguishing the fire or preventing it from spreading.

There were seven college students in the rental house that night in Poughkeepsie. Four made it out. New Canaan resident Kevin Johnson, a student at Duchess Community College at the time, Kerry Fitzsimmons, a Marist senior from Long Island, and Eva Block, a Marist senior, did not. “One Innocent Life is dedicated to raising awareness about the living conditions of college students, involving fire safety,” the organization’s website explains.

“The annual number of fires in dormitories, fraternities, sororities and barracks reported to U.S. fire departments has been substantially higher in recent years than any time prior to 2000,” the NFPA’s Richard Campbell said in August 2016.

The National Fire Prevention Association suggests that students renting off campus housing – and other renters – ask the following of landlords:

  • Does every room have a smoke alarm?
  • What is the power supply to the detector (hardwire/battery/both)?
  • Who provides the battery replacement?
  • Does the off-campus housing have sprinklers and fire extinguishers?
  • What is your disciplinary policy toward tenants who cause false alarms or fail to evacuate during an alarm?
  • Do the rooms have enough outlets with enough power to feed energy needs?
  • Can the exit doors be opened from the inside without a key?
  • What fire safety training does your building staff receive?

One Innocent Life's video to extend awareness, made with the help of Wesleyan University, the City of Middletown Professional Firefighters Local 1073, includes more than a dozen volunteers from Connecticut.

https://youtu.be/9tVQGDyzUHQ

State Steps Up to Help Residents Locate What’s Lost

Connecticut’s Office of State Treasurer has long been responsible for what is described as “unclaimed property” – assets that rightful owners have lost track of – as well as efforts to reunite people with their money.  Now, the State Department of Insurance is getting into the “lost and found” business, too. Insurance Commissioner Katharine L. Wade has announced that the Department is offering a free online service to help consumers search for a deceased family member’s lost life insurance policies and annuities.connecticut-insurance-department-logo-2

“It can be a frustrating and overwhelming process at times to locate a missing policy. Whether you are settling the estate of a deceased loved one or trying to help an elderly relative sort out his or her affairs, the Department has resources to help,” Commissioner Wade said. “We are pleased to offer this latest tool that will streamline and simplify the process while protecting confidentiality.”

The Department’s  Frequently Asked Questions    will help consumers through the process. Consumer requests to find a lost policy are encrypted and secured to maintain confidentiality. Participating insurers will compare submitted requests with available policyholder information and report all matches to state insurance departments through the locator. Companies will then contact beneficiaries or their authorized representatives within 90 days.

The Life Insurance Policy Locator, developed by the National Association of Insurance Commissioners (NAIC), provides free nationwide access for help in finding old policies and annuities. There are an estimated $1 billion in benefits and life insurance policies that are unclaimed in the U.S.

ct-big-list-logoAlso this month, the State Treasurer’s office is closing the year with a push urging consumers to check the agency’s CT Big List to determine if misplaced assets can be claimed.  State Treasurer Denise L. Nappier said the special online publication is one component of the Treasury’s efforts to reunite rightful owners with their unclaimed property and is available through its homepage, www.ott.ct.gov.

The mission of the Treasury’s Unclaimed Property Division is to safeguard assets until rightful owners step forward to claim them. Unclaimed property includes money from uncashed payroll checks, bank accounts and utility deposits, insurance proceeds, liquidated assets from safe deposit boxes, stocks, and bonds.

The electronic special edition at www.CTBigList.com has 49,729 names with property valued between $50 and $100; 36,467 names with property valued between $100 and $500; 4,941 names with property valued between $500 and $1,000; 3,538 names with property valued between $1,000 and $5,000; and 551 names with property valued greater than $5,000. Five owners have unclaimed property valued at more than $100,000, with two having property valued at more than $250,000.

The Treasury’s interactive website, www.CTBigList.com, contains the complete list of about 1.5 million names of individuals and entities that may be entitled to as much as $807 million in unclaimed property. The website features a searchable database -- updated with new names weekly -- that makes it easy for residents to find their names. Often, people are unaware that they have inherited money, and others may simply have forgotten an old savings account or payroll check that went uncashed, officials point out.

Treasurer Nappier emphasized, “Searching the Treasury’s unclaimed property website is free.” She said that state residents are regularly contacted by firms, often called “finders,” offering search services for fees that go as high as 10 percent of assets recovered – and that some individuals hire these firms, believing it is the only way to recover lost assets.

“But that’s not true. My advice is that before you send your hard earned money to strangers, check out the CT Big List first – there is no charge for this public service,” Treasurer Nappier said.

CT Residents See Regionalism as Viable Option for Local Services; Highway Improvement A Transportation Priority

Connecticut residents believe that some services traditionally handled by individual municipalities  can be effectively delivered regionally.  A new statewide survey found that public health earns the most support for a regional approach and public safety the least.  More than 3 in 4 people (76%) say that public health services can be provided on a regional basis, followed by animal control (68 percent) and education (66 percent).  The survey found that 65 percent of state residents believe that library services can be delivered regionally, and 61 percent share that view regarding public safety services. The survey for InformCT, a public-private partnership that provides independent, non-partisan research, analysis, and public outreach, was administered by researchers from the Connecticut Economic Resource Center, Inc. (CERC) and Smith & Company.  The analysis is based on the responses of survey of 510 state residents, with a margin of error of 5 percent. logl

Survey respondents were asked about regionalization of services in surveys conducted in the first three quarters this year, and support was generally consistent – respondent’s views of regionalizing the various services did not vary more than four percentage points for any of the policy areas during that time.  Favorability of regionalization of public health services has increased each quarter, while regionalizing education has increased from Quarter 1.  While support for regional public safety services has also increased from Quarter 1, it received the least support among the services queried in each survey.  Only regionalizing libraries has seen a decline from the first quarter, and preferences for regionalizing animal control has held steady.

stats
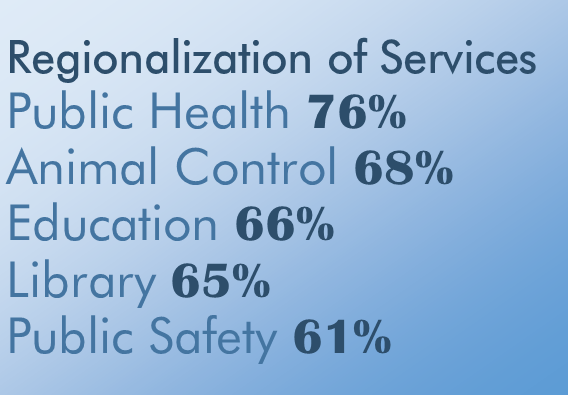
“Increasingly, towns will not be able to afford to sustain the level of services to which they have become accustomed, as budget pressures increase along with a reluctance to raise taxes. Residents showed concern, and a willingness to consider regionalism as a partial solution,” said Robert W. Santy, who serves as Board Chair of Inform CT and is President & CEO of the Connecticut Economic Resource Center (CERC) Inc.

The  also found that the most important factor when choosing a town in which to live, is property taxes, followed by the quality of the school system.  Those factors earned 53 percent and 51 percent of respondents, respectively, who describe the factor as “very important” - the only aspects  described as very important factor by a majority. Other factors deemed very important include recent appreciation of home values (30 percent), proximity to transportation and employment (29 percent) and proximity to entertainment ad amenities (24 percent).

The survey  also asked about transportation in Connecticut, finding that 74 percent said they use their car almost every day.  Other modes of transportation were not nearly as popular.   More than 80 percent indicated that they had used a local bus (86%), long distance bus (91%), commuter rail (87%), Amtrak (92%), an airplane (92%) or a bicycle (82%) only once, or not at all, in the past month.  Regarding state spending to improve transportation, respondents ranked highway improvements as the highest priority by a wide margin, with commuter rail, local bus, and bicycle lanes/pedestrian walkways, ranked next highest.  Highway improvements was described as the highest priority by more respondents than the other six options combined.