UConn is One of 10 Colleges Selected for Program to Recruit Minority Male Teachers

According to data collected by the American Association of Colleges for Teacher Education (AACTE), 80 percent of PK-12 teachers nationwide are white, middle-class women, and more than 40 percent of public schools have no teachers of color. Studies by the National Center for Education Statistics report that 2 percent of public school teachers are black males and fewer are Hispanic males. Forty percent of Connecticut public school students will never have a teacher who is not white, according to the Capitol Region Education Council (CREC), noting that "although minority students account diverseteachersfor over a third of Connecticut's public school students, only 7 percent of the state's teachers and 2 percent of the administrators in Connecticut's public schools are minorities."

If those numbers are to change and reflect a more diverse teacher population, recruitment of teacher candidates will be a pivotal component, education officials point out.

With that objective in mind, the University of Connecticut has been selected as one of 10 universities nationwide to participate in a program that seeks to increase the diversity of the teacher candidate pool. The Neag School of Education at UConn as part of the Networked Improvement Community (NIC), an AACTE initiative aimed at recruiting more black and Hispanic men into teacher preparation programs.

UConn, a member of the 800-member AACTE, was selected to participate in the organization’s first Networked Improvement Community project, which seeks to increase the diversity of the nation’s teacher candidate pool. The other institutions selected are Boston University, California State University Fullerton, Florida Atlantic University, MidAmerica Nazarene University, Northeastern Illinois University, University of Arkansas at Little Rock, University of Saint Thomas, Western Kentucky University, and William Paterson University of New Jersey.

Saroja Barnes, senior director for professional issues at AACTE, says universities were selected for the program based on great diversity within the school districts and community they serve, alignment of the project’s goals to the existing strategic initiatives and mission of the institution, and strategic attention to enrollment trends.chalkboard-MINORITY

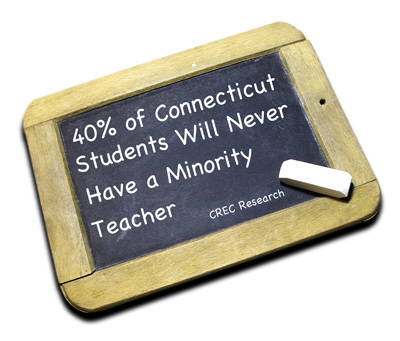
According to a study last year by the American Association of Colleges for Teacher Education, 82 percent of candidates who received bachelor’s degrees in education in 2009-10 and 2010-11 were white. By contrast, census figures show that close to half of all children under 5 in 2008 were members of a racial or ethnic minority, The New York Times reported.

In the 2013 study, AACTE surveyed close to 700 colleges and universities that train just under two-thirds of new teachers, finding that few candidates graduate with credentials to teach math, science, special education or English as a second language, all subjects that experts say are increasingly important to prepare students for jobs and to meet the demands of an increasingly diverse student population.

A report by the Center for American Progress, Increasing Teacher Diversity: Strategies to Improve the Teacher Workforce indicated in 2011 that “increasing the number of teachers of color is not only a matter of a philosophical commitment to diversity in career opportunities.

Teachers of color provide real-life examples to minority students of future career paths. In this way, increasing the number of current teachers of color may be instrumental to increasing the number of future teachers of color. And while there are effective teachers of many races, teachers of color have demonstrated success in increasing academic achievement for engaging students of similar backgrounds.”  Adds CREC, "It is important that all children have access to positive role models from a variety of backgrounds in order to be successful in an increasingly global society."

Thomas DeFranco, Dean of the Neag School, says goals for expanding the diversity of teacher preparation within the Neag School of Education align closely with the objectives of AACTE. Those efforts, according to UConn Today, include the creation of the Teacher Prep Academy in Bulkeley High School in Hartford; designation of an academic advisor specifically charged with recruiting minority students into the Integrated Bachelor’s/Master’s Program; and providing a variety of scholarship opportunities, such as the Connecticut State Minority Teacher Incentive Grants.

More than 50 member institutions in 25 states applied to be a part of the inaugural NIC and 10 were selected following a rigorous review by the AACTE Committee on Professional Preparation and Accountability.

Child Support Caseloads Climb; Distributions to Families, Children Drop - Opposite of National Trend

From fiscal year 2012 to fiscal year 2013, Connecticut’s child support caseload increased, administrative expenditures climbed, and collections distributed to children and families dropped, setting the state apart from national trends. During the FY2013, total child support collections nationwide increased by one percent from the previous year, to $31.9 billion. The amount distributed to children and families increased by 1.7 percent over FY2012, according to data compiled by the federal Office of Child Support Enforcement and reported by the National Conference of State Legislatures. child support chart

Connecticut’s caseload – 206,221 total cases – ranked the state 28th in the nation, the same position as a year ago. The previous year, Connecticut’s caseload was 202,736. Total distributed collections dropped to $242,343,350 in FY2013 from $245,369,851 in FY201child support wall2.

Nearly 95 percent of the amount collected was distributed to the family while just 5 percent was retained by the state as reimbursement for public assistance, according to the nationwide data. At the same time, caseloads and administrative expenditures decreased nationwide.

In Connecticut, however, the volume of cases increased by just under 3,500. Expenditures climbed from $69,637,919 to $73,001,269.

The largest caseloads in FY2013 were in Texas (1.42 million), California (1.29 million), Michigan (996,000), New York (918,000), Ohio (899,000), and Florida (855,000).

Each year, the federal Office of Child Support Enforcement (OCSE) releases a report detailing information about financial and statistical program achievements based on quarterly and annual data. OCSE compiles this information from status reports submitted by states and tribes detailing program performance.

The complete OCSE FY2013 Preliminary Report is available online.

Best Places for Home Ownership? Glastonbury, Enfield, Terryville Top List

The best places for home ownership in Connecticut are in Glastonbury, Enfield and Plymouth, according to an analysis that included home ownership rates, monthly homeowner costs, median household income, home value and population growth. Glastonbury Center, the Southwood Acres section of Enfield and the Terryville section of Plymouth were ranked as the top three slices of Connecticut for home ownership in the analysis by the website nerdwallet.com, which provides analysis on financial and consumer issues. Rounding out the top 10 were the Kensington section of Berlin, Simsbury Center, Cos Cob, Trumbull, Windsor Locks, Orange and North Haven.home map

NerdWallet looked at 60 communities in Connecticut with populations of at least 5,000 to determine what places were the best for homeownership. Overall, the pointed out that “although its median home value is substantially higher than the national average, Connecticut’s proximity to New York and Massachusetts, and its many commuting options, make the state a top destination for homeownership.”

Of the top three, the website pointed out:

  • With a two-year population growth of 6.95% and an unemployment rate of just 1.4%, Glastonbury Center has all the signs of a top home destination.
  • Up north, near the border with Massachusetts, Southwood Acres is within driving distance of Hartford and Springfield, Mass., and boasts the highest homeowner rate among our top 10.
  • Terryville is the largest village within the town of Plymouth. It has shown relatively strong population growth (2.57%), and is the most affordable median home value among our top 10.

The next ten on the list of best places for home owneership in Connecticut include: 11. Shelton (city), 12. Newington, 13. Stratford, 14. Wethersfield, 15. West Hartford, 16. Bethel, 17. Riverside section of Greenwich, 18. East Haven, 19. Milford (city), and 20. Winsted.

The analysis focused on three main questions:

Are homes available? They looked at the area’s homeownership rate to determine the availability of homes. Areas with a high homeownership rate led to a higher overall score. (A low homeownership rate was seen as indicating competitive inventory, more options for renters rather than buyers and expensive housing.)

Can you afford to live there? They looked at median household income, monthly homeowner costs and median home value to assess affordability and determine whether residents could live comfortably in the area. Monthly homeowner costs were used to measure cost of living. Areas with high median incomes and low cost of living scored higher.

Is the area growing? The website’s analysis measured population growth to determine if the area is attracting new residents and showing signs of solid growth. This was seen as a signal of a robust local economy - another attractive characteristic for homebuyers.

Homeownership rate and population change from 2010 to 2012 each made up 33.3% of the total score, using data from the U.S. Census American Community Survey 5-year estimates. Selected monthly owner costs as a percentage of median household income made up 16.7% of the total score, and median home value made up 16.7% of the total score.


top 20

Most Exciting in Connecticut? New Haven, New London, Hartford Lead the Way

Wondering where the most exciting places are in Connecticut? If New Haven is the first place that comes to mind, you’re right. New Haven was named the “Most Exciting Place in Connecticut,” followed by New London, Hartford, Stamford, and Manchester in an analysis by the real estate website Movoto. Described as “the most thrilling, the most rousing, and the most downright exciting,” the top 10 list for Connecticut includes five Fairfield County municipalities and many of the state's largest cities: TOP10

1. City of New Haven 2. City of New London 3. City of Hartford 4. City of Stamford (tie) 4. Town of Manchester (tie) 6. City of Bridgeport 7. City of Norwalk 8. Town of West Hartford 9. Town of Greenwich 10. Town of Westport

The website’s analysis pointed out that “New Haven had a ton of nightlife and music venues per capita” and was “much more densely populated than most other places in the state.” New London scored points in the website’s analysis for its “high percentage of young folks (just like New Haven, 36 percent between 18 and 34), and for its high number of nightlife options, music venues, and arts per capita.” New London ranked No. 1 in both nightlife and music venues, and No. 2 for its arts.

The highlights for Hartford noted that the Capitol City is “the second-most densely populated place in Connecticut; a good portion of that population is between the ages of 18 and 34- 31 percent, to be exact. With bars like Pourhouse and the Russian Lady, music venues like Webster Theatre, and so many museums, galleries, and festivals we can’t even name them all, Hartford is certainly way more exciting than just insurance.”

In order to come up with the list of 10, the website started out with a list of all the places in Connecticut with populations of 10,000 or more, according to the U.S. Census (2010), which provided 38 towns and cities. Then, they used the Census and business listings to assess:

  • Nightlife per capita (bars, clubs, comedy, etc.)
  • Live music venues per capita
  • Active life options per capita (parks, outdoor activities, etc.)
  • Arts and Entertainment per capita (movie theaters, festivals, galleries, theaters, etc.)
  • Fast Food restaurants per capita (the fewer the better)
  • Percentage of restaurants that are not fast food (the higher the better)
  • Percentage of young residents ages 18 to 34 (the higher the better)
  • Population density (the higher the better)

The municipalities were then ranked with scores from one to 38, where the lower the score, the more exciting the place.

Two Greater Hartford communities, in addition to the city, made the list – Manchester and West Hartford.

“Manchester also scored highly for its number of arts and entertainment options per capita, like the unique MCC on Main,” a program of Manchester Community College located on Main Street in the heart of the town. West Hartford, the website reported, “seemed to find its excitement, not in the nightlife … but in lots of healthy options,” including sports stores, gyms, galleries, theaters and “tons of restaurants.” Westport “really shined” in the number of yoga studios, sports stores, running clubs, parks, and places to get fit.”

Falling just outside the top 10 were West Haven, Stratford, Torrington, Middletown, Groton, New Britain, Storrs, Danbury, Derby and Wethersfield.

exciting

Jonathan's Dream Reimagined to Kick-Off Next Chapter

The original Jonathan's Dream playground, inspired by the Barzach family of West Hartford and built in 1996 as what would become the prototype for Boundless Playgrounds across the country, an inclusive, accessible play space for families and children of all abilities. It was a vibrant playground until 2013, when time and heavy usage of the wooden playground necessitated that it be taken down. But now, community leaders are back at it again, developing plans for what is described as “Jonathan's Dream Reimagined” – a new playground that will be accessible to children of all abilities - and include some new innovations for today's children.  Sunday, July 27, from 12 Noon to 3 PM,  will be the kick-off for the new effort, with free activities for children at the Mandell Jewish Community Center, site of the playground.

The new Jonathan's Dream will be designed to extend the original legacy with an engaging playground that keeps children of all ages and abilities active and moving. Leadership Greater Hartford (LGH) has convened a taskforce of alumni JD_NewLogo from its Quest and Third Age Initiative programs to help rebuild the new Jonathan's Dream, working with the Mandell JCC.. The project is also supported by Shane’s Inspiration and Jumpstart, along with a “Dream Team” of local agencies and individuals who have joined forces to advance the initiative.

Jonathan’s Dream Re-Imagined will be rebuilt three to six months after the needed funds are raised. Donations to help rebuild Jonathan’s Dream will be accepted at the July kick-off event. The project to rebuild Jonathan’s Dream is expected to cost $950,000 and, once funds are raised, will take three to six months to complete.JDEntrance

The original Jonathan’s Dream (photo at right), a wooden, wheelchair- accessible, inter-generational playground, was built by more than 1,000 volunteers in 1996 in memory of Jonathan Barzach, who died before his first birthday. Had Jonathan lived, he would have needed to use a wheelchair for his entire life. His family imagined that in Jonathan’s dreams, he would have wanted children of all abilities to be able to play and celebrate together.

Jonathan’s Dream was one of the first inclusive playgrounds in the country.  It led the way for the nonprofit organization Boundless Playgrounds, which coordinated the construction of similar playgrounds throughout the country.  Today, more than 100,000 children play on more than 200 Boundless Playgrounds in 31 states.

It began in Connecticut, with the inspirational leadership of Amy Barzach, Jonathan's mom. Back in 1994, she was at a playground with her two sons when she noticed a little girl in a wheelchair who could not join in the fun because the playground was not accessible to her.  A year later, she remembered that little girl when disability, then tragedy, reached her family, with Jonathan's passing.  With husband Peter and son Daniel, they began the effort to build an inclusive playground, and called it Jonathan's Dream.

To learn more about Jonathan’s Dream Reimagined please visit www.jonathansdreamreimagined.org.

CT Slips from #18 to #21 in State Bikeability Comparison

Connecticut has dropped from 18th to 21st in the rankings of the bicycle-friendliest states, according to the League of American Bicyclists 2014 survey. Every year, the League ranks all 50 states on their bikeability, based on a mutli-faceted Bicycle Friendly State℠ questionnaire. They look at five categories: Legislation & Enforcement, Policies & Programs, Infrastructure & Funding, Education & Encouragement, and Evaluation & Planning.

Overall, the state received 40 out of 100 points, slightly less that the 40.9 earned a year ago, when Connecticut ranked 18th.

On aBFA_SurveyButton_0 1 to 5 scale, with 5 being the highest grade, Connecticut received a 4 in legislation & enforcement, 3 in policies & programs, 3 in education & encouragement, and a 1 in infrastructure & funding.

The top-ranked states were Washington, Minnesota, Wisconsin, Delaware, Oregon, Colorado, Maryland, Utah and California.  Connecticut, ranked 21st, was between Idaho and Tennessee. The top state in New England for bicyclists was Massachusetts, ranked 10th, according to the survey.bike to work

The survey highlights "10 signs of success" in analyzing each of the states.  Connecticut currently has 6 of the 10 in place, according to the survey report:  an active state advocacy group, Complete Streets policy, state bicycle plan, bicycle safety emphasis in the strategic highway safety plan, bicycle education for police, and a safe passing/vulnerable user law.

The Bicycle Friendly State℠ program is designed to establish best practices in states across the program.  In the 2014 survey, the least bicycle-friendly states were Alabama, Montana, and Kentucky.

The League, established in 1880, represents bicyclists in the movement to create
 safer roads, stronger communities, and a bicycle-friendly America. Through information, advocacy and promotion, the organization works to celebrate and preserve the freedom cycling brings to members everywhere.


CT Ranks in Top 10 for Lowest Total Carbon Emissions, Lowest Per Capita Emissions

Connecticut ranks in the top 10 among the states in both the lowest total state energy related carbon dioxide emissions and emissions per capita.  The state ranked second, tied with California and just behind New York, in the lowest emissions levels per capita.  In total state energy related emissions, Connecticut placed in a tie for tenth place. Greenhouse gas emissions for all sources were considered in compiling the data, according to Bloomberg.com, which published the rankings last month, based on 2011 U.S. Census population estimates and statistics from the U.S. Energy Information Administration.  Sources of emission include electric power production, industries, residential heating and transportation.

The lowest state emission levels per capita, in metric tons of carbon dioxide, are New York (8.1), Connecticut (9.2), California (9.2), Oregon (9.3), Vermont (9.6), Massachusetts (10.0), Washington (10.1), Idaho (10.1), Rhode Island (10.5) and Maryland (11.0).  The highest levels per capita were in Wyoming (112.6), North Dakota (79), Alaska (52.7) and West Virginia (51.7).

In total state energy related carbon dioxide emissions, by million metric tons, the states with the lowest emission levels are Vermont (6), Rhode Island (11), Delaware (12), South Dakota (14), New Hampshire (16), Idaho (16), Maine (17), Hawaii (19), Montana (32), Connecticut (33) and Nevada (33).

The states with the highest emission levels were Texas (656 metric tons), California (346), and Pennsylvania (245).


carbon emissions

Connecticut Ranks #14 in Union Membership

Connecticut’s percentage of union members in its workforce – 13.5 percent - places the state at #14 in the nation for the percentage of union members. The top ten states are New York (24.4 percent), Alaska (23.1 percent), Hawaii (22.1 percent), Washington (18.9 percent), Rhode Island (16.9 percent), California (16.4 percent), Michigan (16.3 percent), New Jersey (16 percent), Illinois (15.8 percent), and Nevada (14.6 percent).

At the otimagesher end of the scale, the states with the smallest percentage of union members are Utah, Mississippi, South Carolina, Arkansas and North Carolina, all under 4 percent union members, according to data reported by Bloomberg.com.

Connecticut, ranked #14 just behind Massachusetts, has seen its percentage of union membership decline from 16.4 percent in 2000 to 14 percent at the start of 2012 to 13.5 percent at the start of 2013.

Nationwide, union membership has dropped from 20.1% of the workforce in 1983 to 11.2% last year, according to the website 24/7 Wall Street.Image: Fireman's helmet with union sticker

The union membership rate is defined as the percent of wage and salary workers that are members of a union. The data on union membership were collected as part of the Current Population Survey (CPS), a monthly sample survey of about 60,000 households that obtains employment information among the nation’s civilian non-institutional population aged 16 and over.

The union membership rate is updated annually by the U.S. Bureau of Labor Statistics. The data used was from 2012; the 2013 data is anticipated in September 2014.

Strong Freedom-of-Information Laws Reduce Government Corruption About 20 Percent, Study Finds

Freedom of Information (FOI) laws in states across the country have reduced the rate at which officials committed corrupt acts by about 20 percent, according to an analysis by Adriana S. Cordis of Winthrop University and Patrick L. Warren of Clemson University. In the immediate aftermath of implementation of strong FOI laws, corruption-conviction rates approximately doubled, suggesting that the regulations made it easier to detect malfeasance. Over time, conviction rates declined, suggesting that overall corruption diminished, the authors say. The changes are more pronounced in states with more intense media coverage, the study noted.

The paper states that “if we consider only state and local convictions per government employee, then the most corrupt states for the years 1986-2009 are Montana, Mississippi, North Dakota and New Jersey, and the least corrupt states are Iowa, Utah, Colorado, South Dakota and New Hampshire.”foi logo

Connecticut, which came to be referred to as “Corrupticut” in the wake of political scandals involving former Gov. John G. Rowland, former State Treasurer Paul Silvester, former Waterbury Mayor Philip Giordano and former Bridgeport Mayor Joe Ganci (among others), is not highlighted in the study. The state was among the first to adopt strong FIO laws in the 1970’s. In the aftermath of the killings at Sandy Hook in 2012, state officials have been revising some of those laws, raising concerns among FOI advocates.

The study indicates that 12 states switched from weak to strong FOIA during their two decade sample period: New Hampshire (1987), South Carolina journal of public economics(1988), Idaho (1991), Utah (1993), Washington (1993), West Virginia (1993), New Mexico (1994), Texas (1996), North Dakota (1998),Nebraska (2001), New Jersey (2002), and Pennsylvania (2003).

“Based on average scores, Connecticut, Indiana, Louisiana, Colorado, and Vermont are among the states with relatively stronger access laws, while South Dakota, Alabama, Arizona, Wyoming and Nevada are among the states with relatively weaker access laws,” the researchers stated.

The authors pointed out that “FOI laws provide clear guarantees regarding the rights of individuals and organizations to access information about government activities, and they make it easier for members of the press and members of the public at large to hold those in power accountable for their actions.”

They conclude that utilizing a variety of econometric specifications, that the short-run effect of a state moving from weaker to stronger FIO laws “is an approximate doubling in the probability that a corrupt act is detected and convicted.” They continue, “corruption conviction rates decline from this new elevated level as the time since the switch from weak to strong FOIA increases.” Cordis stressed to CT by the Numbers that the approximately 20 percent decline in the rate at which officials commit corrupt acts in response to a stronger FOI law is an estimate based on the research.

The paper was published this month in the Journal of Public Economics and has been featured this year on the Social Science Research Network and was highlighted by Harvard Business Review.

s200_adriana.s._cordisAdriana S. Cordis is an Assistant Professor of Accounting at Winthrop University in South Carolina. Her areas of teaching expertise include managerial and cost accounting, and her research focuses on capital-market and transfer-pricing issues. She also has a long-standing interest in corruption from a public policy perspective. Patrick L. Warren is an Assistant Professor in the Department of Economics at Clemson University. His research has focused on decision making in public sector organizations, auditing and political accountability.

Connecticut Energy Costs are Third Highest in the US, Analysis Finds

The only states in the nation with higher monthly energy bills for consumers are Mississippi and Hawaii. Connecticut is ranked as the 3rd most energy expensive state in the country, according to a new analysis by WalletHub, which used six key metrics to rank the swh-best-badges-150x150-2tates according to their tendency to produce the highest or lowest monthly energy bills. The analysis points out that “lower prices don’t always equate with lower costs, as consumption is a key determinant in the total amount of an energy bill.” Connecticut’s monthly energy cost for consumers, according to the analysis, is $404, ranking the state 49th out of 51 (the 50 states plus the District of Columbia). Mississippi’s total monthly cost paid by consumers averages $414, while Hawaii’s is $451.

In terms of specific energy sources, the state ranked 50th in monthly electric cost ($143) and 48th in the cost of natural gas ($94). Perhaps due to the size of Connecticut, the state ranked 14th in fuel cost, at $167 per month, despite the state’s gas tax being among electricity pricethe highest in the nation. (see breakdown below)

In the United States, 7.1 percent of the average consumer’s total income is spent on energy costs, including fuel, natural gas and electricity.

The states with the least expensive energy costs for consumers, taking consumption into account, are Colorado ($301), Washington State ($302), Montana ($305), Rhode Island ($307), Nebraska ($312), the District of Columbia ($314), Pennsylvania ($317), Arkansas ($319), Delaware ($319) and Iowa ($319).

The other New England States, in addition to Rhode Island landing towards the top and Connecticut near the bottom, were bunched in the middle: Massachusetts ranked #35, New Hampshire #26, Vermont #28, and Maine #32. natural gas

Breaking out prices from consumption, Connecticut’s energy picture for consumers as compared with other states, is:

  • 49th – Price of Electricity
  • 16th – Electricity Consumption per Consumer
  • 44th – Price of Natural Gas
  • 48th – Natural Gas Consumption per Consumer
  • 46th – Price of Fuel
  • 10th – Fuel Consumption per Driver

The analysis was released in July because it tends to be the hottest month of the year in the contiguous U.S., and as a result it has the highest energy consumption.wallethub map

If you’re wondering how all this was calculated, WalletHub provides the answer: (Average Monthly Consumption of Electricity x Average Retail Price of Electricity) + (Average Monthly Consumption of Natural Gas x Average Natural Gas Residential Prices) + [Average Fuel Price * (Average Monthly Vehicle Miles Traveled / Average Car Consumption / Number of Drivers)] = Average Monthly Energy Bill Consumers Pay in Each State

WalletHub, described as “the social network for your wallet,” provides data to help readers “make smart financial decisions.” The site points out that “during the summer, when many Americans undergo major life transitions such as relocating to start a new job or start a family, the difference in energy costs among states becomes an important financial consideration.”  Connecticut ranks #49.