More Daughters Mean More Venture Capital Investment, More Success, Study Shows

As the growing number of Connecticut start-up firms seek to attract venture capital funds to propel their growth, a newly published study may suggest some surprising influences on the investment decisions – and ultimately the success of venture capital investments. A National Bureau of Economic Research (NBER) working paper by Paul A. Gompers and Sophie Q. Wang from Harvard University says that gender diversity may boost performance of venture capital firms.  But it is not the gender diversity of the start-up firms leaders, or the gender diversity of the venture capitalists, who tend to predominantly be white males.

It is the gender diversity of the children of venture capitalists that appears to make the difference.

The paper, “And the Children Shall Lead: Gender Diversity and Performance in Venture Capital,” is based on a study of a dataset of gender of venture capital partners’ children. It finds that partners with more daughters than sons were more likely to hire female partners. But that’s not all.

The study also finds that having more girl children had a positive effect on deal and fund performance of these partners.  The authors indicate that the effects concentrate overwhelmingly on the daughters of senior partners than junior partners.

“Taken together, our findings have profound implications on how the capital markets could function better with improved diversity,” they say in the paper’s abstract.

Venture capital firms are typically deep-pocketed, small companies that bet on startup success by investing millions in exchange for an ownership interest and hopes of high returns.  Published reports indicate that according to the study, firms that increased their gender diversity by hiring more women saw their deal success rate increase by nearly 3 percent. Their profitability, as measured by internal rates of return, rose by more than 3 percent.

Venture capital in Connecticut is available from a range of private and quasi-public sources, including Connecticut Innovations.

The 62-page paper was posted last week; Paul Gompers is Professor of Business Administration and Director of research for the Harvard Business School Finance Unit.  Sophie Q. Wang is a PhD student in the Department of Economics at Harvard University. They based their results on some 12,000 venture-capital investments made between 1990 and 2016, primarily by U.S.-based firms.  They also studied personal information obtained from some 1,400 investing partners.

The NBER is a private, non-profit, non-partisan organization dedicated to conducting economic research and to disseminating research findings among academics, public policy makers, and business professionals.

Five Connecticuts: Disparities Persist, Continue to Adversely Impact State's Children

Connecticut is among the wealthiest states in the country, and aggregated statewide economic, health, and education indicators suggest that children and families fare better here than in much of the United States. According to a new report developed by the Connecticut Association of Human Services, the reality on the ground is not what it appears to be. “Race Equity in the Five Connecticuts:  A Kids Count Special Report,” found that Blacks’ and Hispanics’ poverty rates are lower in Connecticut than nationally, and Blacks’ median incomes are higher. However, “as we have seen when looking within communities, historic patterns of inequality observed nationally do indeed persist here.”

The report indicates that as is the case nationally, Blacks and Hispanics in Connecticut are “disproportionately impoverished, and have the highest rates of negative outcomes for most of our indicators. Merely being a resident of one of the most affluent states in the U.S. is not a sufficient buffer against the intransigent inequality that affects our children and families along racial and ethnic lines,” the report explains.

"Not all children in our wealthy state are doing well," summed up Jim Horan, Chief Executive Officer of the Connecticut Association of Human Services, in releasing the report at a State Capitol complex conference. "All children, regardless of the color of their skin or their zip code, should have the opportunity to succeed. Connecticut can do much more to provide opportunity for all and address the huge inequities we see today, so that all children will prosper and contribute to and share in Connecticut’s growth," he said in the report's Foreword.

“Five Connecticut’s” refers to a breakdown developed by the Connecticut Data Center based upon each town’s median income, population density, and population below 100% of the poverty threshold (Levy, et al, 2004).

  • Wealthy Connecticut towns have “exceptionally high-income, low poverty, and moderate population density.”
  • Suburban towns have “above average income, low poverty, and moderate population density.”
  • Rural towns are those with “average income, below average poverty, and the lowest population density.”
  • Urban Periphery towns are marked by “below average income, average poverty, and high population density.”
  • Urban Core towns have “the lowest income, highest poverty, and the highest population density.”

The report used data from communities representing each of the five Connecticuts:  Wealthy (New Canaan, W3ilton, Weston, Easton, Fairfield); Urban Periphery (East Hartford and Manchester); Urban core (Hartford); Suburban (Branford, East haven, North Branford, Guilford and Madison); and Rural (Ashford, Brooklyn, Canterbury, Chaplin, Eastford, Hampton, Killingly, Plainfield, Pomfret, Putnam, Scotland, Sterling, Thompson, Woodstock, and Windham).

“Blacks are more segregated in Connecticut than in Arkansas and Hispanics are more segregated than in Texas,” pointed out Orlando Rodriquez, research associate at the UConn Health Disparities Institute, speaking at a forum on the report at the Legislative Office Building, noting that Connecticut is among the nation’s most segregated states.

Demographically, Connecticut, like the nation, is becoming more racially and ethnically diverse. It is estimated that by 2055, America will not have a single racial or ethnic majority.  From 2000 to 2015, as the total population grew by 5%, Connecticut’s Black, Hispanic, Asian, and Native American populations combined grew by 42.3%. In 2000, Connecticut’s population was 22.5% Non-White; in 2015, it was 30.8%.

The research also found that “place can correlate somewhat with the degree of the differences observed across these indicators, with outcomes either ameliorated or exacerbated depending on one’s ‘Connecticut’ of residence.”

The general trend, the analysis indicated, “is that White and Asian children and families experience positive outcomes, while their Hispanic and Black counterparts are almost invariably worse off. Even in those areas where Hispanic and Black households have relatively higher median incomes, they often still have worse outcomes than White and Asian households for many non-economic indicators.”

“Place remains tightly intertwined with opportunity, compounding the effects we observe along racial lines,” the report indicated.

“While more affluent suburban towns offer safer neighborhoods and greater social and economic opportunity to residents,67 these neighborhoods and towns tend to have less affordable housing and perhaps less economic opportunity for employees of limited credentials. Finances tie less affluent families to areas of low opportunity, contributing to a cycle of poor outcomes.”

Officials said the report is intended to be the beginning of a “more nuanced and continuous conversation about the role of place in social and economic equity in the State of Connecticut,” to assist in the development of “policies that work earnestly to close the racial and ethnic gaps among our families and children.”

In 2000, Connecticut’s population totaled 3,405,565, with 2,638,845 non-Hispanic Whites, 309,843 Blacks, 320,323 Hispanics, 9,639 Native Americans, and 82,313 Asians. In 2015, the estimated total population was 3,593,222, with 2,478,119 non-Hispanic Whites, 346,206 non-Hispanic Blacks, 526,508 Hispanics, 8,908 Native Americans of any ethnicity, and 149,368 non-Hispanic Asians.

Minorities, Children with Autism at Greater Risk of Drowning; Legislative Response Launched

“I understand all too well the dangers that water can represent,” said Karen Cohn, founder of the Zac Foundation, pointing out that drowning is the second leading cause of death for children under age 14.  “Many of these deaths could have been prevented.” Cohn’s 6-year-old son drowned in 2007 after his arm became stuck in the suction of the drain in their backyard pool.  Although he was a strong swimmer, “swimming skills are not enough to combat an entrapment,” she said.  The foundation named for her son is dedicated to educating parents about water safety, which goes beyond swimming skills.  The ZAC Foundation held its first water safety awareness camp, called ZAC Camp in Greenwich in April 2011. “We can save lives,” Cohn stressed.

Cohn was among advocates and legislators who held a State Capitol news conference to announce the creation of a legislative task force to bring awareness to the issue of childhood drownings.  Steven Hernández,, Executive Director of the Commission on Women, Children and Seniors, said the goal of the effort was “to prevent tragedies like these,” adding that “we need a multi-pronged response to a multi-pronged problem.”

The initiative was launched during National Water Safety Month, held each year in May, driven by statistics including:

  • Almost 800 children die the U.S. every year from accidental drowning;
  • 54% of these deaths are among children ages 0-4;
  • African-American and Latino children are more than twice as likely to die from drowning, compared to Caucasian children; and
  • According to the National Autism Association, accidental drowning led to 90% of the deaths of children with autism ages 14 and younger.

The statistics about children’s drowning deaths have not changed over time, implying that current strategies for prevention are not enough, officials said. Increasing children’s access to swim lessons, encouraging schools to teach water safety skills to students and giving parents easy-to-use and engaging tools to talk to their children about how to be safe around water are just a few actions that can have a big effect in reducing drowning rates, officials stressed.

An issue brief on the subject, prepared by Jennifer L. Masone of the Institute for Educational Leaders, and Principal, Wolfpit Elementary School in Norwalk, indicated that “from 2004-2014, 62 children from birth to 19 died from unintentional drowning. Of those, 35% were white and 34% were minority while the general population averaged 75% white and 25% minority. These data do not include children who experienced other short or long term effects.

The State Department of Public Health corroborates this information with its summation that for 2000-2004, “The Non-Hispanic Black population experienced a drowning rate twice that of the Non-Hispanic White population, and 33% higher than the Hispanic population.”

Senate Majority Leader Bob Duff said the issue needs to be “seen as a community solution through education.”   He said “this is an issue we can solve,” saluting the effort to bring interested parties together to work collectively.

In addition to establishing the task force, proponents of the initiative highlighted their support for HB 6260, which would require police officers to be trained to handle incidents involving juveniles with autism.  The measure has passed the House and is awaiting Senate action. Rep. Liz Linehan, who introduced that bill, said, “Children with autism are at an increased risk of drowning because they have a tendency to wander away from adult supervision and to seek out bodies of water.”

Rep. Cathy Abercrombie said “accidental drownings in Connecticut are a serious problem that deserves our full attention and one thing we can stress is the need for more education for parents and people overseeing children, especially now as we approach summer.”


https://youtu.be/CULPxBSa_10

https://youtu.be/hkmY3oZWxyU

In New England, Most Believe At Least Half of High School Grads Not Ready for College, Career

New Englanders overwhelmingly believe that at least half of high school students across the region graduate unprepared for college and a career, and that student-centered learning environments are part of the solution to this readiness problem. That’s according to the results of a poll that reflects growing concerns that children are not fully equipped for life after high school.  It is seen by some as a tipping point in public opinion that positions student-centered learning—which tailors education to the interests and needs of each student—as an answer to providing young people with the skills and knowledge they need to succeed upon entering post-secondary education and the workforce.

That’s according to the Nellie Mae Education Foundation (Nellie Mae) which released the poll that was conducted by the Rennie Center for Education Research & Policy, which surveyed 2,400 individuals across the region from August 5-31, 2016.

“Although graduation rates are at an all-time high, New Englanders are well aware that a diploma alone is no longer sufficient to ensure success for our students after high school,” said Nick Donohue, president & CEO of the Nellie Mae Education Foundation.

Among Connecticut residents, 33% said most graduates are prepared for college and a career, 48% said about half of graduates are ready, and 18% believe that “few graduates” are prepared for college and career.  Connecticut and New Hampshire had the highest percentage indicating that “most graduates” are prepared, with one-third of respondents (33%) expressing that view.

“Too frequently students arrive at college requiring developmental or remedial classes to strengthen basic skills just to move on to college-level material, or they begin careers without the tools and skills necessary to help them early on in their professional lives. The situation is more severe for people in traditionally marginalized communities – places that we need to prosper so our society can advance. The good news is that student-centered approaches to learning represent a path forward in which all students can succeed.”

There were some differences among the states.  In Connecticut, 48 percent said “some changes are needed, but basically schools should be kept the same.”  Only 14 percent said “public schools work well as they are now,” while 30 percent said “major changes are needed” and 8 percent said “a complete overhaul is needed” (the smallest percentage among the New England states).

A significantly greater proportion in Rhode Island believe “a complete overhaul is needed” than in Connecticut, Massachusetts, New Hampshire and Vermont.   A significantly greater proportion in Maine believe “a complete overhaul is needed” than in Connecticut.

Nearly two-thirds of those surveyed in Connecticut (64%) called for “using technology to enhance the way students learn in the classroom” – the highest percentage among the six New England states.  A majority called for “more significant efforts to close achievement gaps” (59%), more effective teachers (62%) and changes to the ways schools are funded (57%).  The state legislature in Connecticut is currently considering changes in the school funding formula proposed by Gov. Malloy in the wake of a state court decision.

According to Nellie Mae, across New England, only 50 percent of high school students are graduating with the skills and knowledge necessary to succeed after high school. These poll results show that New Englanders not only agree this is unacceptable, but that 90 percent believe that student-centered learning environments are part of the solution toward ensuring high school graduates are college and career ready.

Nellie Mae defines student-centered learning as personalized and happening anywhere, anytime. In student-centered environments, students move ahead based on mastery of content rather than class-seat time and they exert ownership over their own learning.

New Englanders found teachers to be among the most trusted group when it comes to educational decision-making and showed confidence in their ability to improve public education. Respondents also reported having confidence in parents and school and district leaders for improving education.

The poll comes amidst efforts by Nellie Mae to reshape public education in New England to reach an aggressive benchmark of 80 percent college and career readiness among our high school graduates by 2030. The Foundation is investing $200 million in grantmaking efforts toward advancing student-centered learning in schools and districts across the region in order to achieve this goal.

The Nellie Mae Education Foundation is the largest philanthropic organization in New England that focuses exclusively on education.

To read the poll report in its entirety, please visit http://bit.ly/2k4Dvv5

16 CT School Districts Named Among Nation's Best Communities for Music Education

Sixteen Connecticut school districts are among 527 districts across the being recognized as being among the Best Communities for Music Education (BCME). The annual listing of outstanding music education programs, now in its 18th year, is developed by The National Association of Music Merchants (NAMM) Foundation in cooperation with researchers at The Music Research Institute at the University of Kansas.

The awards program recognizes outstanding efforts by teachers, administrators, parents, students and community leaders who have made music education part of the curriculum. Designations are made to districts that demonstrate an exceptionally high commitment and access to music education. These districts "set the bar in offering students access to comprehensive music education," according to officials at the NAMM Foundation.

The Connecticut school districts earning a slot on the Best Communities list:  Avon Public Schools, Bethel Public Schools, Bristol Public Schools, Canton Public Schools, Cheshire Public Schools, Fairfield Public Schools, Glastonbury Public Schools, Newington Public Schools, Newtown Public Schools, Plainville Community Schools, Regional School District No. 8, Simsbury Public School District, Southington Public Schools, Torrington Public Schools, West Hartford Public Schools, and Westport Public Schools.

To qualify for the Best Communities designation, local school districts answered detailed questions about funding, graduation requirements, music class participation, instruction time, facilities, support for the music program, and community music-making programs. Responses were verified with school officials and reviewed by The Music Research Institute at the University of Kansas.

Last year, 13 Connecticut school districts were named, among 476 districts nationwide.  New to the list this year are Avon, Fairfield, Plainville, and Regional School District No. 8.  Falling from the list is Wilton.   

The designation takes on added significance this year, officials point out, with new research showing strong ties between K-12 school students who actively participate in school music education programs and overall student success. A recent study of students in the Chicago Public Schools by brain researchers at Northwestern University, detailed in Neuroscientist and Education Week, builds on previous findings that participation in music education programs helps improves brain function, discipline and language development, according to officials.

“Studying music has intrinsic benefits and, on its own, is core to learning.  Also, the links between student success and music education have now been demonstrated by brain researchers in multiple studies,” said Mary Luehrsen, Executive Director of The NAMM Foundation. “The schools and districts our foundation recognizes are building on that connection between music and academics. These schools and districts are models for other educators who see music as a key ingredient in a well-rounded curriculum that makes music available to all children, regardless of zip code.”

The NAMM Foundation is a nonprofit supported in part by The National Association of Music Merchants and its approximately 10,300 members around the world. Its mission is to advance active participation in music making across the lifespan by supporting scientific research, philanthropic giving, and public service programs.

Disconnected Youth: Fewer in Connecticut Than Nationally; Disparities Reduced But Continue

Fewer young people across the country are disconnected from school and work today than were before the Great Recession, according to new national data. The 2015 youth disconnection rate, 12.3 percent, is below the 2008 rate of 12.6 and well below the 2010 youth disconnection peak, 14.7 percent. All of Connecticut’s five Congressional Districts show lower rates of disconnected youth than the national average.

That’s a 16 percent drop over five years translates to roughly 900,000 fewer young people cut off from pathways that lead to independent, rewarding adulthoods, according to data compiled by the Social Science Research Council.

The report, “Promising Gains, Persistent Gaps,” compares the degree of youth disconnectedness in Congressional Districts across the country.

Disconnected youth are teenagers and young adults between the ages of 16 and 24 who are neither in school nor working. Being detached from both the educational system and the labor market during the pivotal years of emerging adulthood can be dispiriting and damaging to a young person, and the effects of youth disconnection have been shown to follow individuals for the rest of their lives, resulting in lower incomes, higher unemployment rates, and negative physical and mental health outcomes. The harms accrue not only to young people themselves, but reverberate across time and place, making youth disconnection a national concern that must be addressed by society at large.

Youth disconnection rates vary enormously by congressional district—from an impressively low rate of 4.4 percent in Wisconsin District 2, the mostly urban Madison area, to an alarmingly high rate of 23.1 percent—or nearly one in every four young people—in Kentucky District 5 in rural Appalachia.

Connecticut fares relatively well.  Northeastern and Midwestern congressional districts have lowest rates of youth disconnection, 11.1 percent on average.

Connecticut’s best ranked Congressional district is the 2nd, in Eastern Connecticut, with an 8.7 percent of youth ages 16-24 disconnected, ranking 60th among the nation’s 435 Congressional districts.  Next best if Connecticut’s 5th district, in Western Connecticut, ranked 116th with 9.9 percent disconnected youth.  The 3rd C.D. ranks 134th, at 10.1 percent; the 4th C.D ranks 104th with 10.3 percent; and the 1st C.D. ranks 167th at 10.9 percent.

On average, a gap of 7.4 percentage points separates the best and worst districts within a state. Connecticut’s gap is only 2.2 percentage points.

The greatest disparity is found in New York State; a worrisome 15.2 percentage points separate New York’s District 20 in the Albany area (7.1 percent) and District 15 in New York City’s South Bronx (22.3 percent).

The most equitable state in terms of youth disconnection is also found in the Northeast; a nearly negligible 0.1 point separates Maine’s District 1, which hugs the southern coast and includes the capital, Augusta (9.8 percent), and District 2, a more rural district that encompasses most of the state (9.7 percent).

The analysis found that nationally, young women are slightly less likely to be disconnected than young men. And there is “astonishing variation in disconnection rates by race and ethnicity.” The share of young people cut off from workforce and educational opportunities, the report found, ranges from only one in fourteen Asian American youth to more than one in four Native American youth. The Asian American youth disconnection rate is 7.2 percent; the white rate is 10.1 percent; the Latino rate is 14.3 percent; the black rate is 18.9 percent; and the Native American rate is 25.4 percent.

The report concludes that “at-risk youth need the kind of support from communities and institutions that other young people take for granted: safe places to live and food on the table; caring adults to help them navigate the often-bewildering transition from child to adult; opportunities to try new things, to fail, and to try again; and experiences that build not just hard and soft skills for the marketplace, but also self-knowledge, agency, and confidence.”

Achieve Hartford Aims to Push for Progress in Hartford Schools, From Top Down and Bottom Up

In the aftermath of Hartford Mayor Luke Bronin’s State of the City address and a comprehensive three-part investigative series published by the Hartford Courant examining the city’s decades-long response to the Sheff decision on integration and quality education, Achieve Hartford! is preparing for its second annual fundraising event and intensifying efforts to encourage sustainable education progress in the city. “Compare the mayor’s role in addressing the fiscal crisis, promoting regionalization, union renegotiations, the fight against blight, or key quality of life issues like resolving a flawed 311 system,” the organization said this month. “In each of these areas as well as several others, Mayor Bronin and his leadership team came together publicly and with a clear mandate directed from the top across departments to solve problems, making the combined whole greater than the individual roles and parts.  Now is a time where city leaders are called to step up as education leaders.”

In promoting their second annual “Inspire Hartford” event slated for May 11, organizers are urging attendees to “see innovation in action” and hear “uplifting stories of success.” They add: “learn how innovative ideas and new technology are training the next generation of bright dreamers and big thinkers. Get educated—and be inspired.”

The keynote speaker will be Charles Best, who leads DonorsChoose.org, the pioneering crowdfunding nonprofit where anyone can help a classroom in need. At DonorsChoose.org, public school teachers create classroom project requests and donors can choose the projects they want to support. Best launched the platform in 2000 out of a Bronx public high school where he taught history. Today, more than two thirds of U.S. public schools have at least one teacher who has created a project request on DonorsChoose.org, and 1.8 million people have donated $360 million to classroom projects reaching 16 million students.

Achieve Hartford!, which was formed in 2008, is an independent nonprofit organization founded by business and community leaders “with the belief that strong schools lead to a strong city,” noting that  “Mayors, Boards of Education and Superintendents change over time.”

“We are doing everything we can to lay out a blueprint for systemic change in Hartford that can help guide collective efforts to improve schools, and we look forward to working with the mayor, the next superintendent, and so many others critical to putting education reform in Hartford back on track,” the organization said earlier this month, while noting that Bronin indicated “strengthening our neighborhood schools must be the single most important priority for our new Superintendent, and I pledge to be a full partner.”

Last week, the search for a new Superintendent for the city was narrowed to two candidates: Acting Superintendent Leslie Torres-Rodriguez and Capital Region Education Council (CREC) Assistant Superintendent for Operations Tim Sullivan.

Achieve Hartford warned that “If Hartford leaders, stakeholders, and families put the responsibility for fixing Hartford schools solely on the new superintendent, we should not expect either finalist to be successful.  The responsibility must be shared amongst the Board of Education, City Hall, the corporate community, philanthropy, nonprofit partners, and even our robust institutions of higher education.”

The organizations stresses that it works “toward improving education in our city by innovating ways to address some of our toughest issues, activating the community to take ownership of problem solving, and holding our leaders and educators accountable for advancing student achievement.”

Summarizing recent activities, the organization’s website says succinctly, “there is a lot of conversation but, ultimately, not much action.”

“Developing great schools require not only that the school system operate with excellence, but also our entire community,” the organization’s website points out. “It takes a village to educate a child, and it is our job to help stakeholders play their unique set of roles for school improvement now, and long into the future.”

The May 11 fundraising event will take place at the Hartford Hilton.

Schools of Distinction in Connecticut; 116 Earn Designation

Over 100 schools statewide across Connecticut have been recognized by the Connecticut State Department of Education (CSDE) as 'Schools of Distinction' for the 2015-2016 school year. The state recognized 116 schools for high academic achievement and high growth, including 15 schools within the state's Alliance District program. The state's alliance district program is a targeted investment in Connecticut's 30 lowest-performing districts.

To qualify for the distinction designation, schools cannot have high achievement gaps or high graduation rate gaps, and must also meet participation rate requirements.  'Schools of Distinction' are schools that meet the following criteria, according to the CSDE.

  • the top ten percent of schools using the Accountability Index score;
  • the top ten percent of schools with the highest growth for all students or for the high-needs group (free or reduced price lunch, English language learners, and students in special education); or
  • the top ten percent of schools (among those without growth) with improvement in Accountability Index.

Danbury, Greenwich and Ridgefield have six schools each on the list, the most of any district in the state.

Shelton, Stratford and Trumbull had four schools among those designated, and Glastonbury and Regional School District 12 each had three schools earn a slot on the list.  West Hartford had three schools named, Braeburn, Bugbbee and Whiting Lane..

Two Capital Region Education Council (CREC) schools made the list, The Ana Grace Academy of the Arts Elementary School and the University of Hartford Magnet School.  CREC renamed one of its magnet schools in 2014 in honor of Ana Grace Marquez-Greene, a former Hartford resident who was among the young victims of the Sandy Hook school shooting.


2015-2016 Schools of Distinction

  • Anna H. Rockwell School, Bethel
  • Frank A. Berry School, Bethel
  • Bolton High School, Bolton
  • Mary R. Tisko School, Branford
  • Brass City Charter School, Waterbury
  • Ana Grace Academy of the Arts Elementary School, Avon
  • University of Hartford Magnet School, West Hartford
  • Chapman School, Cheshire
  • Norton School, Cheshire
  • Lewin G. Joel Jr. School, Clinton
  • M. Wright Technical High School, Stamford
  • Ellsworth Avenue School, Danbury
  • Hayestown Avenue School, Danbury
  • Mill Ridge Primary School, Danbury
  • Morris Street School, Danbury
  • Park Avenue School, Danbury
  • South Street School, Danbury
  • Ox Ridge Elementary School, Darien
  • Royle Elementary School, Darien
  • Tokeneke Elementary School, Darien
  • East Haddam Elementary School, East Haddam
  • Dominick H. Ferrara School, East Haven
  • East Lyme High School, East Lyme
  • Lillie B. Haynes School, East Lyme
  • Niantic Center School, East Lyme
  • Windermere School, Ellington
  • Burr Elementary School, Fairfield
  • Timothy Dwight Elementary School, Fairfield
  • Jennings School, Fairfield
  • Riverfield School, Fairfield
  • East Farms School, Farmington
  • Noah Wallace School, Farmington
  • Union School, Farmington
  • West District School, Farmington
  • Eastbury School, Glastonbury
  • Hopewell School, Glastonbury
  • Nayaug Elementary School, Glastonbury
  • Wells Road Intermediate School, Granby
  • International School at Dundee, Greenwich
  • North Mianus School, Greenwich
  • North Street School, Greenwich
  • Old Greenwich School, Greenwich
  • Parkway School, Greenwich
  • Riverside School, Greenwich
  • Northeast Academy Elementary School, Groton
  • B. Butler School, Groton
  • Guilford Lakes School, Guilford
  • Regional Multicultural Magnet School, New London
  • Litchfield Intermediate School, Litchfield
  • Southeast Elementary School, Mansfield
  • Casimir Pulaski School, Meriden
  • Thomas Hooker School, Meriden
  • Orange Avenue School, Milford
  • Pumpkin Delight School, Milford
  • Oakdale School, Montville
  • Western School, Naugatuck
  • East School, New Canaan
  • New Canaan High School, New Canaan
  • West School, New Canaan
  • Conte/West Hills Magnet School, New Haven
  • Anna Reynolds School, Newington
  • Hawley Elementary School, Newtown
  • Green Acres Elementary School, North Haven
  • Ridge Road Elementary School, North Haven
  • North Stonington Elementary School, North Stonington
  • Wheeler High School, North Stonington
  • Samuel Huntington School, Norwich
  • Thomas W. Mahan School, Norwich
  • Kathleen E. Goodwin School, Old Saybrook
  • Moosup Elementary School, Plainfield
  • Plainfield Central School, Plainfield
  • Plymouth Center School, Plymouth
  • Brownstone Intermediate School, Portland
  • Redding Elementary School, Redding
  • Harwinton Consolidated School, Harwinton
  • Booth Free School, Roxbury
  • The Burnham School, Bridgewater
  • Washington Primary School, Washington Depot
  • Burr District Elementary School, Higganum
  • Haddam Elementary School, Higganum
  • Lyme Consolidated School, Lyme
  • Mile Creek School, Old Lyme
  • Barlow Mountain Elementary School, Ridgefield
  • Branchville Elementary School, Ridgefield
  • Farmingville Elementary School, Ridgefield
  • Ridgebury Elementary School, Ridgefield


  • Scotland Elementary School, Ridgefield
  • Veterans Park Elementary School, Ridgefield
  • West Hill School, Rocky Hill
  • Chatfield-LoPresti School, Seymour
  • Booth Hill School, Shelton
  • Elizabeth Shelton School, Shelton
  • Long Hill School, Shelton
  • Sunnyside School, Shelton
  • South Windsor School District, Pleasant Valley School
  • Eli Whitney School, Stratford
  • Nichols School, Stratford
  • Second Hill Lane School, Stratford
  • Stratford Academy - Johnson House, Stratford
  • Booth Hill School, Trumbull
  • Jane Ryan School, Trumbull
  • Middlebrook School, Trumbull
  • Tashua School, Trumbull
  • Yalesville School, Wallingford
  • Braeburn School, West Hartford
  • Bugbee School, West Hartford
  • Whiting Lane School, West Hartford
  • Edith E. Mackrille School, West Haven
  • Seth G. Haley School, West Haven
  • Daisy Ingraham School, Westbrook
  • Coleytown Elementary School, Westport
  • Green's Farms School, Westport
  • Alfred W. Hammer School, Wethersfield
  • Wilton High School, Wilton
  • B. Sweeney School, Windham
  • Frisbie School, Wolcott


Disparities Evident As Fairfield County Considers Its Community Wellbeing

Fairfield County’s sizeable immigrant population - twenty percent of Connecticut’s most populous county - grew 89 percent from 1990 to 2014. In some municipalities, foreign-born residents make up as much as a third of the population. That is among the findings in the Fairfield County Community Wellbeing Index 2016, which examined regional demographics, economic opportunity, education, health, quality of life, and happiness.  The report includes analysis of the communities, populations, and neighborhoods of Fairfield County, as well as opportunities available and issues facing the area.

Since 1980, the size of the population living in neighborhoods that are considered most affluent – defined as those with an average family income more than 2.5 times higher than the state level - has tripled within Fairfield County. Meanwhile, the number of people living in poor neighborhoods is 3.5 times its 1980 size. The number of people in middle-income neighborhoods has decreased by sixteen percent.

Fairfield County’s Community Foundation, a major funder of the report, partnered with DataHaven, area hospitals, and government agencies to help launch a more robust and comprehensive resource that could serve as a part of the hospitals’ and health departments’ Community Health Needs Assessments as well as a broader county-wide indicators program.

“Fairfield County’s Community Foundation is committed to addressing the most pressing issues facing Fairfield County, but to do that we first need to be able to identify and understand those issues,” stated Nancy M. von Euler, Vice President, Programs, Fairfield County’s Community Foundation. “The data in the Fairfield County Community Wellbeing Index 2016 will help us to develop priorities for collective action to build a stronger, healthier Fairfield County where everyone has the opportunity to thrive, regardless of their zip code.”

The report states that "Despite its overall affluence, Fairfield County is among the nation’s most unequal metropolitan areas. Inequities in well-being appear when evidence is stratified by income, age, race, gender, and zip code. These differences are often most apparent after considering data that were collected specifically for the age groups and neighborhoods that are most impacted."

Among the findings, between 2014 and 2025, adults ages 65 and over are Fairfield County’s only age group projected to grow significantly, with a thirty-seven percent increase. Disparities in the County were also evident:

  • High and rising childcare costs are often prohibitively expensive for low and middle-income families. While Fairfield County has nearly enough spaces for all 3- to 4-year-olds to attend preschool, there are only enough regulated childcare slots for fifteen percent of the county’s children ages 0 to 2, and enough subsidized slots to cover only twenty-two percent of these youngest children in low-income households.
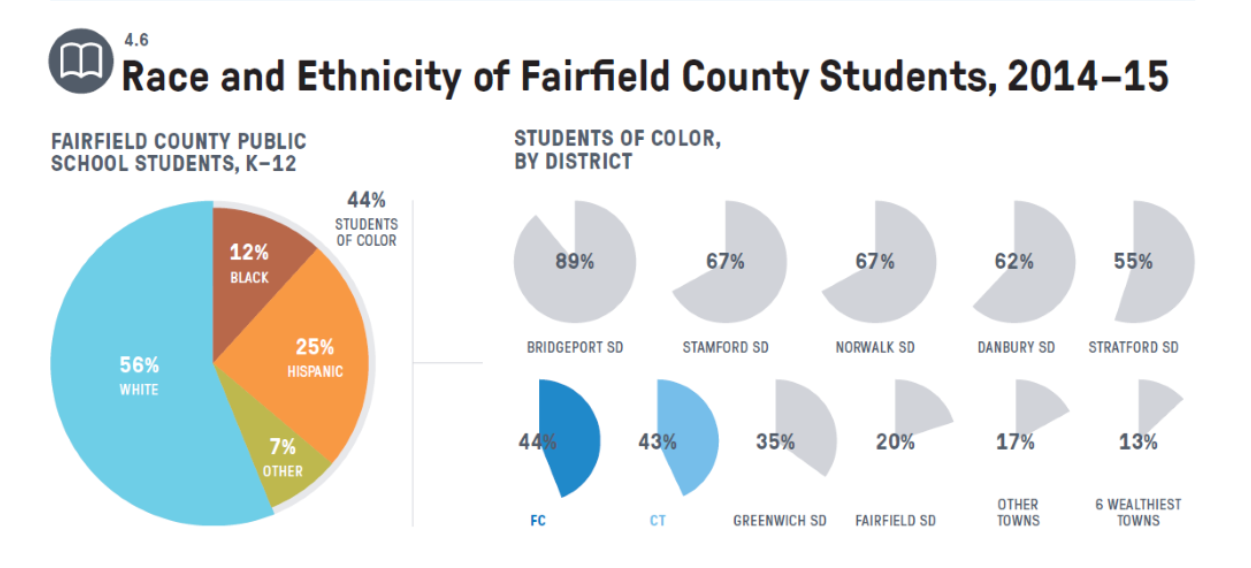
  • The issue of dental care arose as an indicator of well-being, particularly among younger adults and families. The Index shows that for every 10,000 residents living in Fairfield County, 12 residents visit an emergency room to receive treatment for preventable dental conditions in any given year, whereas on the East Side of Bridgeport, 178 residents do.
  • Fairfield County residents are healthy when compared to national benchmarks. However, many conditions and risk factors—such as asthma, food insecurity, exposure to community violence, and the early onset of diabetes—are disproportionately prevalent in lower-income neighborhoods and communities of color. Sections of Bridgeport in particular fall very far behind the surrounding area in many of these measures.
  • Disparities in access to reliable transportation persist between racial and income groups. A majority of Fairfield County workers, regardless of income, commute to another town for work. Many low-income (annual wages under $40,000) workers leave Bridgeport for work, while large shares of high-income workers commute to New York City.

“The process of developing this report allowed local partners and community members to identify links between the well-being of residents and the places where they live. Looking beyond typical measures like income levels or unemployment rates, the Community Wellbeing Index reveals a much more uneven distribution of opportunities in areas such as neighborhood walkability, economic development, public health, and education,” said Mark Abraham, Executive Director of DataHaven and a lead author of the report. “The impact that these barriers to opportunity have on overall well-being and happiness will serve as a call to action for many groups working to improve Fairfield County’s diverse neighborhoods and towns.”

The Fairfield County Community Wellbeing Index 2016 was based on a variety of federal and statewide data sources. Partners of DataHaven’s Fairfield County Community Wellbeing Index 2016 include Fairfield County’s Community Foundation; Bridgeport Hospital; Danbury Hospital; Greenwich Hospital; Norwalk Hospital; St. Vincent’s Medical Center; and Stamford Hospital.

Healthy Eating Not So Great Among Children, Community Can Help

Only one-third of parents of children ages 4-18 feel they’re succeeding at fostering healthy eating habits in their kids, according to a recent national survey.  The University of Michigan C.S. Mott Children’s Hospital National Poll on Children’s Health found that just over half of parents believe their children eat mostly healthy, and only one in six parents rate their children’s diets as “very nutritious,” according to a press release. A fourth of parents polled said their child’s diet is “somewhat or not healthy at all.” Common challenges – not surprisingly - get in the way, according to experts: price, picky eaters and convenience.

“Most parents understand that they should provide healthy food for their children, but the reality of work schedules, children’s activities and different food preferences can make meal preparation a hectic and frustrating experience,” poll co-director Sarah Clark explained. “The tension between buying foods children like, and buying foods that are healthy, can be an ongoing struggle. Many of us know the feeling of spending time and money on a healthy meal only to have our children grimace at the sight of it and not take a single bite.”

Other data from the poll – which involved 1,767 parents – include that one in five parents don’t think limiting their child’s intake of fast food or junk food is important, and that 16 percent said limiting sugary drinks is “somewhat or not important.”

In general, parents of teens were less worried about unhealthy eating habits compared to parents of younger children.

The C.S. Mott Children's Hospital National Poll on Children's Health measures current national public opinion, perceptions and priorities regarding major health care issues and trends for U.S. children and people in their communities.

Also this month, the Rudd Center for Food Policy and Obesity at the University of Connecticut found that residents of one Maryland county bought fewer sugary drinks after a campaign to reduce the consumption of sugar-sweetened beverages that included policy changes and public health outreach efforts.

The Rudd Center study, published in JAMA Internal Medicine, is the first to use objective retail sales data to measure the effectiveness of a community-led campaign to reduce consumption of sugary drinks.

“This study demonstrates the power of a community-based public health campaign that combines health-supporting policy changes with extensive outreach. The residents of Howard County have been engaged in every phase of this effort and their commitment to switching their drinks showed up in the supermarket sales data,” said Marlene Schwartz, Director of the UConn Rudd Center for Food Policy and Obesity, and the study’s lead author.

Beverages with added sugars are among the leading sources of empty calories—calories that supply little or no nutrients—for both children and adults, and overconsumption of sugar is associated with obesity and increased risk of heart disease.

The study’s key findings show that based on sales data from Howard County supermarkets:

  • Sales of sugar-sweetened soda declined nearly 20 percent.
  • Sales of 100 percent juice fell 15 percent.
  • Sales of fruit drinks with added sugars fell a little more than 15 percent.

Comparing sales data in 2012, before the Howard County Unsweetened campaign, to sales data in 2015, researchers found notable declines in purchases over the three-year period.

In determining the campaign’s impact, researchers compared weekly beverage sales of top-selling brands in 15 Howard County supermarkets with a matched group of 17 supermarkets in southeastern Pennsylvania. The study did not include sales data from non-supermarket vendors such as convenience stores.

The Rudd Center for Food Policy & Obesity at the University of Connecticut is a distinguished multi-disciplinary policy research center dedicated to promoting solutions to childhood obesity, poor diet, and weight bias through research and policy.  The study was funded primarily by the Horizon Foundation, with additional funding from the Robert Wood Johnson Foundation, and from the Rudd Foundation to support data collection. Voices for Healthy Kids, a joint initiative of the Robert Wood Johnson Foundation and the American Heart Association, is a strategic partner of both Howard County Unsweetened and Sugar Free Kids Maryland.