“Stop with the financial games and own up to the problem.” That was the succinct comment provided to the 24-member state Spending Cap Commission by Darien resident Ken Weil at a public hearing this fall. Small business owner Justin Higgins, of Orange, added that citizens should “always know where we stand financially without loopholes and political gamesmanship.”
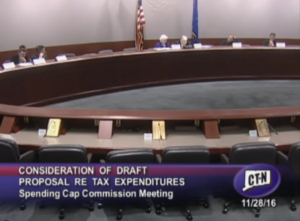
The Commission has held 18 meetings, beginning in March and most recently on November 14, as well as five public hearings during the past two months, during which nearly two dozen people filed testimony. With the state anticipating an estimated $3.1 billion deficit for the next two fiscal years, dollars and sense will be front and center when the legislature, with 30 new members and a dead-even split in the State Senate, convenes in January.
The Commission next meets on Nov. 28, according to CT-N. Public Act 15-1, December Special Session (Section 24) established the Spending Cap Commission, charged with creating, for the purposes of the state's constitutional general budget expenditures requirements, proposed definitions of (1) "increase in personal income", (2) "increase in inflation", and (3) "general budget expenditures".
What the commission has been asked to address is two decades in the making - definitional questions with fiscal implications that have influenced policy and budget balancing since the passage of the state income tax in the early ‘90’s. The Director of UConn’s Center for Economic Analysis, Fred Carstensen, said in an article published this month that “the spending cap as designed has been an unmitigated disaster, fiscally and economically.” 
The Commission is chaired by William Cibes, a former state legislator and Secretary of the Office of Policy and Management when the income tax was imposed and state spending cap was approved by voters, and Patricia Widlitz, also a veteran former legislator. Members include Republicans and Democrats currently serving in the legislature, and others who have extensive experience with state government, in the public or private sector. It is likely that the incoming state legislature will be looking to the Commission’s findings, as it grapples with the way forward for state finances.
As the public hearings approached in October, the Commission voted to include the following proposed definitions to be addressed:
- “Increase in personal income” means the compound annual growth rate of personal income in the state over the preceding five calendar years, according to United States Bureau of Economic Analysis data
- “Increase in inflation” means the increase in the consumer price index for urban consumers, all items less food and energy, during the preceding calendar year, calculated on a December over December basis, according to United States Bureau of Labor
- The Commission is still considering potential optional language for the third proposed definition – “general budget expenditures” – it is charged with creating. That language may concern, among others, such expenditures as payments for bonds, notes and other evidences of indebtedness, court orders, federal mandates, grants to distressed municipalities, as well as the use of federal funds and monies contained in the budget reserve fund. Proposed language pertaining to these and other additional topics pertaining to general budget expenditures may also be suggested at the public hearing, and considered by the Commission.
Some of the comments received by the Commission, at hearings in Hartford, New Haven, Bridgeport, Willimantic and Waterbury, are quite clear on what the result ought to be done, even if precise wording is not offered:
 Louise DiCocco, Assistant Counsel for the Connecticut Business & Industry Association, noted that “24 years ago, more than 80 percent of Connecticut votes overwhelmingly approved a spending cap to keep the cost of state government within the taxpayers’ means to afford it. Voters demanded the cap as an offset to the persona income tax in Connecticut. The state must enact a spending cap that is ironclad and works.”
Added the MetroHartford Alliance in testimony by Vice President Patrick McGloin: “Adoption by the legislature of well-crafted spending cap definitions will clearly demonstrate to our fellow residents and private sector employers that we have the political will to be fiscally disciplined.” DiCocco noted that “the spending cap has always had a safety valve or escape mechanism. They include bonded debt service, aid to distressed municipalities and first year costs of federal or court ordered mandates.”
The Connecticut affiliate of the National Federation of Independent Businesses pointed out that “reasonably understood, clear definitions of the key terms that will lead to additional budget transparency, predictability and ultimately cap state spending on an annual basis in a way that aptly reflects the will of the voters,” adding that “business owners feel that the legislature absolutely needs to stop allowing excessive spending to be an option and to recognize the ‘new economic reality’, just as small business owners have had to do. Achieving that goal is the most effective economic development policy we could have, and we believe that implementing the constitutional spending cap, and properly defining component terms, would go a long way in this regard.”
Westport resident Tom Lasersohn observed that “In business you learn that for every one customer that complains, there are many you have already lost as customers. For every citizen who gives testimony to this Commission, there are many who are so disgusted with the State’s fiscal mismanagement and chicanery that they will leave at the earliest convenient opportunity. Many outside the State peer in and resolve ‘no, not for me until the State gets its fiscal act together.’ A responsible definition for ‘general fund expenditures’ will communicate to both current and prospective residents and businesses that we are serious about fixing our problems.”
 State Senator Toni Boucher of Danbury told the Commission: “I hope that the commission to adopt a definition of general budget expenditures that is comprehensive and gives a complete and realistic account of all the money that the state spends… it is equally critical that the legislature not be allowed to move what was once an expenditure included under the cap to bonding or fund it with a revenue intercept for the purpose of undermining the cap’s integrity.”
The final form of Commission recommendations remains unclear. Minutes of the Commission’s most recent scheduled meetings, on October 31 and November 14, have not yet been posted to the Commission’s website, nor has an agenda for the Nov. 28 meeting (as of Nov. 27).
While Boucher is not a member of the Commission, a number of her legislative colleagues are. The definitions – and the implications for the state’s budget and taxpayers – may soon be theirs to decide. A decade ago, a UConn report observed that “the spending cap is only as restrictive as the legislative process decides it should be; its strictures are not written in stone.”
 UPDATE:
link to Agenda for Commission's Final Meeting on Nov. 28, 2016 and CTNewsJunkie article reporting on meeting.
link to CT-N video of Commission's Meeting on Nov. 28 at the Legislative Office Building in Hartford; Next meeting scheduled for Dec. 5


 The findings of a state review would be reported to the legislature and governor to evaluate the appropriateness of the price increases in question.


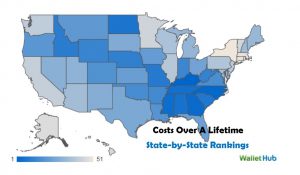
 The report, “Broken Promises to our Children: A State-by-State Look at the 1998 State Tobacco Settlement 17 Years Later," said the state was spending $1.2 million in FY 2016 to fight tobacco use. That's compared to an estimated marketing investment of $80.4 million by tobacco companies in Connecticut that year. The national average shows a margin of 20.1 to 1. At that time, Connecticut ranked 38th in spending on a percentage basis. The state has consistently spend


 That is the highest number of states falling short of revenue projections since 36 states budgets missed their mark in 2010, according to the NASBO report and
 In recent months, First Niagara did consolidate five Connecticut branches (Woodstock, Dayville, Hamden, East Haven and Madison), and all of the employees who worked at those branches were offered positions within the bank, officials indicated, and no layoffs were associated with that consolidation.
 At #296 is Glastonbury-based Fiondella Milone & LaSaracina. FML was founded in 2002 “for the purpose of providing professional auditing, tax and business consulting services to a wide range of clients and industries throughout the Northeast,” the company’s website indicates. After working together at Ernst & Young, the firm’s founding partners, Jeff Fiondella, Frank Milone and Lisa LaSaracina launched FML.
 counting newsletter and the award-winning National Benchmarking Report.


