Dangers of Distracted Driving Attract Renewed Attention; Responses Pending, Urged

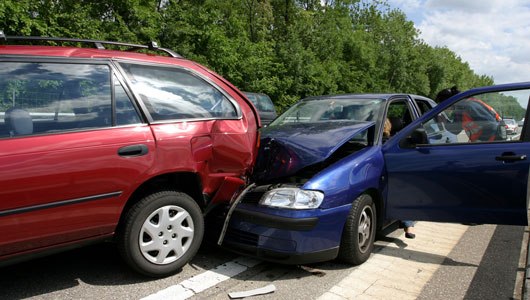
There was a time when smoking was permitted in restaurants, when seat belt use was not mandatory, when children were not required to wear helmets when bike riding.  Then the science of safety interceded, and state lawmakers – in Connecticut and elsewhere - took notice.  The convenience of technology, however, may be another matter.

Writing in The Hartford Courant this week, teen driving safety advocate Tim Hollister, who was a member of the Governor’s Safe Teen Driving Task Force in 2007-8 and publishes a national blog for parents of teen drivers, called for a ban on the use of electronic devices while driving, citing increasing evidence of  the dangers of distracted driving.  And a new study by a Texas university concluded that voice-to-text is as dangerous and traditional typed texting.

Hollister points out that six leading public health and traffic safety organizations (World Health Organization, National Transportation Safety Council, Insurance Institute for Highway Safety, and the Governor’s Highway Safety Association) “now agree that hands-free cellphone use is just as dangerous as hand-held.  Both cause cognitive blindness.”textingdrivingtons

With the addition of a new law passed in Hawaii last week, 40 states, the District of Columbia, the Virgin Islands and Guam have banned text messaging for all drivers using hand-held devices.  Hawaii becomes just the 11th state (including Connecticut, as well as the District of Columbia, Puerto Rico, Guam and the Virgin Islands) to prohibit all drivers from using handheld cell phones while driving.

Not a single state prohibits hands-free dialing, and neither state nor federal action appears on the horizon.  In fact, just the opposite is true.

Even as evidence of hazards grows, so do the range of electronic options.  Ford is one of a number of companies aggressively marketing electronic devices that offer more in-car options.  The company’s voice activated Sync technology, available beginning with 2012 models, includes hands-free calling, 411 business search, audible text messaging, and internet connectivity.  Hollister points out that “on tv and the internet, advertisements tout devices that enable texting by allowing drivers to attach their cellphones to the windshield so the screen is aligned with their view of the road.”

Connecticut Action Pending

Two bills that offer responses to certain aspects of distracted driving are now progressing through the Connecticut General Assembly, which adjourns on Wednesday, June 5.  The Associated Press reported that the House of Representatives voted 139-1 last week to add distracted driving to the list of moving violations that would be made available to insurance companibikees.  Currently, if someone disobeys the state's distracted driving law, they pay a fine and their insurer does not know about it.  The bill also increases fines and creates a task force to study distracted driving prevention. The legislation now moves to the Senate.

The Senate unanimously passed a bill establishing a fine of up to $1,000 for a motorist who "fails to exercise reasonable care on a public way" and seriously injures or causes the death of so-called vulnerable users, such as a bicyclists. The bill now moves to the House, the AP reported.

Federal Guidelines 

The dangers of technology-enabled distracted driving are so insidious – and increasing so rapidly – that the federal government has launched a website, www.distraction.gov, solely devoted to educating the public about the severe risks of distracted driving.  Among the statistics cited:

  • Driving while using a cell phone reduces the amount of brain activity associated with driving by 37%. (Carnegie Mellon)
  • Text messaging creates a crash risk 23 times worse than driving while not distracted. (VTTI)
  • Sending or receiving a text takes a driver's eyes from the road for an average of 4.6 seconds, the equivalent-at 55 mph-of driving the length of an entire football field, blind. Headset cell phone use is not substantially safer than hand-held use. (VTTI)
  • In 2011, 3,331 people were killed in crashes involving a distracted driver. An additional, 387,000 people were injured in motor vehicle crashes involving a distracted driver.
  • 11% of all drivers under the age of 20 involved in fatal crashes were reported as distracted at the time of the crash. This age group has the largest proportion of drivers who were distracted.
  • 40% of all American teens say they have been in a car when the driver used a cell phone in a way that put people in danger. (Pew)

A new study from the Texas Transportation Institute at Texas A&M University reveals that sending those messages using voice-to-text software is just as distracting as looking down at your phone and typing messages by hand.

Voluntary guidelines recently issued (April 2013) by the Department's National Highway Traffic Safety Administration (NHTSA), recommended specific criteria for electronic devices installed in vehicles at the time they are manufactured.  The guidelines include recommendations to limit the time a driver must take his eyes off the road to perform any task to two seconds at a time and twelve seconds total. The guidelines also recommend disabling several operations unless the vehicle is stopped and in park, such as:

  • Manual text entry for the purposes of text messaging and internet browsing;
  • Video-based entertainment and communications like video phoning or video conferencing;
  • Display of certain types of text, including text messages, web pages, social media content.

The department has also issued Blueprint for Ending Distracted Driving, a comprehensive plan on the subject.   The use of all cellular phones while driving a school bus is prohibited in 14 states thus far, including Connecticut, and the District of Columbia.  A federal proposal in 20ll that would have extended a ban on cell phone use – including hands-free – to all vehicles has not been enacted into law nationwide, or in any state.

The Washington Post reported 18 months ago that “Vehicles are being transformed into mobile communications centers, with cellphones, DVD players, access to Facebook and Twitter, Global Positioning System devices, and satellite radio.”

 “Unfortunately, drivers are being encouraged to do everything but drive,” Jonathan Adkins, spokesman for the Governors Highway Safety Association, told the Post. “It’s a sign of the pressures of modern-day life to do 10 things at once. However, driving is a complex task, and our message continues to be that a singular focus is needed.”

Rebranding of Tweed-New Haven Seen as Key to Airport Growth

For a time, it seemed as if Tweed-New Haven Airport would be handling flights without the benefit of air traffic controllers.  That altered state of reality was averted – at least for the time being – when Congress intervened, after federal sequestration budget cuts called for eliminating the control tower personnel this spring.

But at a news conference earlier this month, members of Connecticut’s Congressional delegation stressed that Tweed-New Haven and other regional airports are not out of the woods yet. That means the facility needs to more aggressively state its case – to lawmakers and the public.  Which is precisely what’s being done, with a reinvigorated public information effort including a recently developed website and logo.Tweed

Last July, officials at Tweed launched a new user-friendly website to meet the needs of its expanding customer base. The new website www.flytweed.com makes it easier to price and track flights throughout the world. In addition to the website, a new logo was created and Tweed mobile applications were launched.

The initiative to refresh the airport's identity and branding online was aimed at changing travelers' search habits, placing the airport's code ("HVN") into prominence as the first step at accomplishing that goal.  The tagline “Southern Connecticut’s Airport” is also featured with the revised logo.  The airport is served several times a day by US Airways Express, through connecting flights via Philadelphia to over 130 national or international destinations.

A report issued last year indicated that more airline passengers flew out of Tweed in 2011 than in 10 of the previous 11 years – including a jump of 11% in 2011 over 2010. Figures for 2012 were not immediately available.  Total 2011 departures exceeded the average annual number of departures over the last 12 years by a strong 24%.   It also marked the third consecutive annual increase in the number of passengers flying from Tweed.

In addition to Tweed, the six airports that would have been impacted by the federal cuts include Hartford’s Brainard Airport and the airports in Danbury, Bridgeport, Groton-New London, Waterbury.

Officials have pointed out that with competitive fares, convenient parking and easy access from downtown New Haven and I-95, Tweed’s popularity has grown  from a decade ago. The growth also reflects thedestination_banner-938x333-938x333 increasing vitality of the New Haven business community, reflected in a growing and vibrant retail community and greater demand for residential space in the city. Airport officials have said they will continue working with airline representatives to  seek additional service and destinations.

New Video Seeks to Improve Teen Driving Safety, Recalls Tragic Death of West Hartford Teen

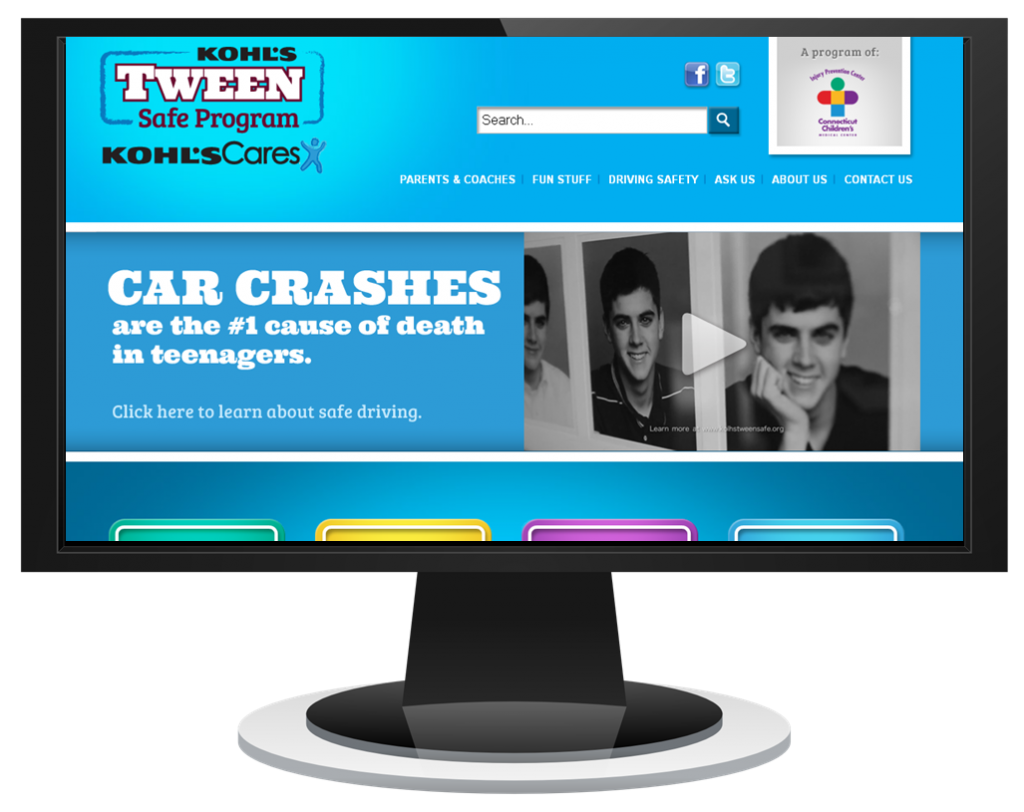
Kohl's Tween Safe Program is currently focusing on the dangers inherent in teen driving.  The  program's website features a new video with the father and sister of  Reid Hollister, a 17-year-old West Hartford resident who was killed in a one-car accident in 2006.  The video, prepared in association with the Connecticut Children's Medical Center,  aims to alert teens and parents to the realities and risks of teen driving.

Reid’s father, Tim Hollister, became a leading advocate for better-informed parental decision-making about teen driving in the months after Reid’s tragic death.  He was a leading member of the Governor’s Safe Teen Driving Task Force in 2007-8, which led to legisReid websitelative passage of a series of stringent laws in Connecticut, including graduated teen  licenses, to lessen the risks of car crashes involving teens.

The short video, with Reid’s dad and sister on camera recounting discussing Reid’s life, and the circumstances surrounding his death, are the featured subject on Kohl’s Tween Safe website, and excerpts of their comments, along with noteworthy statistics, are also be telecast on local television stations as a public service announcement.

Tim Hollister’s blog, "From Reid's Dad," was launched in September 2009 and has been recognized by the U.S. Department of Transportation/National Highway Traffic Safety Administration Public Service Award, April 2010, for "extraordinary efforts to assist parents in making informed decisions about safe teen driving." The site includes a model teen driving agreement for teens and parents, available for download. and helpful information and suggestions regarding teen driving and parental decision-making.

The Injury Prevention Center at Connecticut Children’s Medical Center, in partnership with Kohl’s Cares®, has launched Kohl’s Tween Safe, a website and public information initiative to provide information aimed at preventing all types of injuries. The goal is to share the latest news and research to enable tweens, parents and coaches to make informed decisions.

On December 2, 2006, 17-year-old Reid Hollister, died after a one car accident.  He was driving on a three-lane Interstate highway (I-84 in Plainville) that he likely had not driven before, on a dark night just after rain had stopped, and apparently traveling above the speed limit, “he went too far into a curve before turning, then overcorrected, and went into a spin.” As the blog describes it, “While the physics of the moment could have resulted in any number of trajectories, his car hit the point of a guardrail precisely at the middle of the driver's-side door, which crushed the left-side of his chest.”

Among the statistics highlighted on the site:

  • Safer teen driving starts with informed, conservative decisions about whether teens get behind the wheel of a car in the first place. Teaching teens to operate a vehicle safely is Step 2.
  • Driving is the leading cause of death for people under age 20 in the United States.
  • Safer teen driving is everyone's concern. In 2010, nearly 2,000 teen drivers died, but their crashes killed more than 3,000 passengers, other drivers, and pedestrians.

The video featured on the Kohl’s website was recorded recently when Connecticut Children’s Medical Center approached the Hollister family about making a video about Reid’s story, for teen drivers and their parents.

Earlier this year, the blog reported the following:  “The Governors’ Highway Safety Administration has issued a new report, New Study: Teen Driver Deaths Increase in 2012 (Feb. 26, 2013), based on preliminary fatality statistics for 2012, and the key finding should send a big shiver up our collective national spine:  after years of decline, deaths of 16 and 17 year old drivers increased in the first six months of last year. From 2011 to 2012, the national number of 16 year old driver deaths increased from 86 to 107 and the number of 17 year old deaths from 116 to 133.”

Strategies to Advance Transit-Oriented Development Outlined by Coalition

Strategies including community engagement, placemaking, mixed-income housing, complete streets, parking configuration, green infrastructure and energy efficiency are outlined in a comprehensive 68-page “toolkit” focusing on opportunities to extend transit-oriented development in Connecticut, as the state moves forward with significant rail and bus initiatives.

 Working in partnership, Connecticut Fund for the Environment, Partnership for Strong Communities, Regional Plan Association and Tri-State Transportation Campaign have created a Transit-Oriented Development (TOD) Toolkit that highlights key strategies necessary for developing competitive and sustainable TOD in Connecticut.  The toolkit has been shared in recent weeks with interested officials  and organizations around the state, and discussed at two public forums in Bridgeport that brought together more than   80 municipal leaders from the region.TOD Toolkit

The document outlines the primary components of a TOD program that meets common community goals of strengthening town centers, supporting municipal budgets, expanding housing and commercial opportunities, and minimizing environmental impacts. Among the central components outlined:

  • The process and design for getting TOD built in a community, from developing a community vision and supportive zoning, to determining how accessible a station is for non-drivers.
  • The demographic trends that favor mixed-income, transit-accessible housing, the fiscal impacts of residential TOD, and mechanisms to include affordable housing within TOD development.
  • Complete Streets strategies that enhance streets and sidewalks to promote walking and biking to a station and to TOD built around it. Transit access, walking an bicycling, and the mix of uses in TOD mean that TOD districts require less parking than traditional development.
  • Best practices for managing parking, including parking maximums, shared parking, and transit incentives.  
  • Information and resources for incorporating green infrastructure and energy solutions in a community. Green infrastructure minimizes wastewater and pollutant impacts from development. Energy-efficiency, local energy generation and micro-grids help communities use less power and withstand disruptions to the regional energy supply. housing starts

Efforts are continuing by the organizations participating in the effort, and others pursuing a transit-oriented development agenda, to coordinate with key state agencies regarding strategies to move TOD forward in the state, especially along key transportation corridors.  Officials are working to secure funds for a new TOD position that would initially provide technical support to Meriden and other towns on the upcoming New Haven - Hartford - Springfield rail and CTfastrak bus lines and to develop a funding source to support financing and land acquisition for priority TOD sites.

 Transit-oriented development is described in the toolkit as “development that’s built to take advantage of the ability of people to access it with transit - a strategy for growth that produces less traffic and lessens impact on roads and highways.”  The overview also points out that “households located within walking distance of transit own fewer cars, drive less, and pay a smaller share of their income on transportation related expenses. Homes and businesses can be built with less parking, reducing the cost of development, making development more feasible in weak markets, and increasing local tax revenue.”


Riding to Work, Protecting Vulnerable on the Way

 The goal is 2,500 people.  With the start of CTrides week set to begin on May 13, there are about 250 people registered on the organization’s website of free services and information, thus far.  Officials are hoping for a boost of support in the coming days, and remain optimistic, perhaps encouraged by the arrival (finally) of springtime weather and the increase in cyclists it inevitably brings.  And they acknowledge that many may choose to observe the spirit of the day, without formally registering their participation.

Commuters are asked to carpool, vanpool, take buses or trains, walk, bike or telecommute instead of driving alone to work.  CTrides is not alone in advocating alternate transportation – and the benefits of leaving the car in the driveway, or sharing the ride into work.

BikeWalk Connecticut is urging people to step outside their vehicles - May 8 is National Bike to School Bicycling_best-cardio-exercisesDay and May 17 is National Bike to Work Day.   There are community-based events taking place on May 17 in at least two dozen locations around the state, from Bloomfield and Bethel to Waterbury and West Hartford.  Most are open to the public, and some are held on-site for corporate employees, such as  CIGNA, GE, Aetna and United Technologies.

CTrides notes that Americans spend an average of 47 hours per year sitting in rush-hour traffic, and public transit is viewed as 170 times safer than automobile travel.  An averge family’s second largest expense, after housing, goes to buying, maintaining and operating a car.  For those acutely aware of environmental impacts, it has been estimated that a single person switching to public transportation reduces carbon emissions by 4,800 pounds per year.  On May 9, CTrides goes to college – Southern Connecticut State University in New Haven, specifically.  The midday Community Outreach event will focus on the benefits of sharing a ride. CT_rides2

Protecting Vulnerable Users

Beyond the personal riding advocacy, BikeWalk Connecticut also works for legal changes to make cycling safer.  This year, abike_walk_ct_logo_thumbmong their legislative priorities is the so-called “vulnerable user” bill (SB191).  It would establish a penalty for a motorist who, failing to exercise reasonable care on a public way, seriously injures or causes the death of a “vulnerable user,” provided the vulnerable user exercised reasonable care in using the public way. A driver who causes such injury or death would face a fine of up to $ 1,000. Reasonable care is the degree of care that a prudent and competent person engaged in the same endeavor would exercise under similar circumstances.

The bill applies to any public way, including a public highway, road, street, avenue, alley, driveway, parkway, or place, under the control of the state or any of its political subdivisions, dedicated, appropriated, or opened to public travel or other use.  Under the bill, vulnerable users include: 1. pedestrians; 2. highway workers; 3. bicyclists; 4. anyone riding or driving an animal (e. g. , driving a horse-drawn vehicle); 5. skaters, skateboarders, and roller bladers; 6. people driving or riding on a farm tractor; 7. people in wheelchairs or motorized chairs; and 8. blind people and their service animals.  The states of Washington, Delaware and Oregon have similar laws.  Efforts are underway to have Connecticut follow suit.

Amtrak ridership breaks all-time records, local corridor sees increase

Amtrak ridership increased in the first six months of fiscal year 2013, with ridership in March setting a record as the single best month ever in Amtrak’s history.  Ridership grew 0.9 percent from October 2012 to March compared to the prior year, despite disruptions from weather, including Superstorm Sandy.  Amtrak said 26 of 45 routes had rider increases during the period and monthly records were set in October, December and January. Ridership on the New Haven – Springfield shuttle grew from 33,196 in March 2012 to 36,962 in March 2013, an increase of 11.3 percent.  Ridership from October 2012 through March 2013 grew by 5.2 percent from the same period a year earlier.  The Acela Express ridership dropped off slightly amid the record-breaking numbers, likely due to service interruptions due to Superstorm Sandy, down 2.5 percent last month compared with a year ago.NHHS

The numbers are encouraging as plans continue to move forward for dramatic improvements and expansions of service on the 62-mile New Haven-Hartford-Springfield (NHHS) corridor in the coming years.  Amtrak is continuing the installation of underground signal and communication cables, required to upgrade signal and communication systems for the NHHS rail corridor.

Work this month is scheduled in Newington, Hartford and Windsor.  The NHHS rail service project will connect communities, generate sustainable economic growth, help build energy independence, and provide links to travel corridors and markets beyond the region, officials say.

The new NHHS rail service will operate at speeds of up to 110 mph, cutting travel time between Springfield and New Haven to just 78 minutes. When the new service is launched in 2016, travelers at New Haven, Wallingford, Meriden, Berlin, Hartford, Windsor, Windsor Locks, and Springfield will board trains hourly during the peak morning and evening rush hours and every 90 minutes during off-peak periods. When all the planned improvements are completed, trains will operate every 30 minutes during peak periods. The full program also includes future, amtrak1new train stations at North Haven, Newington, West Hartford, and Enfield.

Nationally, long-distance routes with ridership growth in the October-to-March period included the New York City to Georgia route, the Palmetto, up 10.5 percent, and the Coast Starlight, which operates between Los Angeles and Seattle, up 10 percent.  Amtrak said ridership was up 9.8 percent on the Illini/Saluki, which operates between Chicago and New Orleans; 8.9 percent on the San Joaquin in California, 8.6 percent on the Piedmont in North Carolina and 8.2 percent on the Wolverine route in Michigan.

Amtrak officials say they expect to end the fiscal year at or above last year’s record of 31.2 million passengers.  The sixth annual National Train Day will be celebrated around the country on May 11.

Amtrak is America’s Railroad®, the nation’s intercity passenger rail service and its high-speed rail operator, with more than 300 daily trains – at speeds up to 150 mph (241 kph) – that connect 46 states, the District of Columbia and three Canadian Provinces. Amtrak operates intercity trains in partnership with 15 states and contracts with 13 commuter rail agencies to provide a variety of services.


More Social Capital = Fewer Traffic Accidents, Research Study Finds

If you’ve never made a connection between traffic accidents and social capital, you’re probably not alone.  However, the Harvard Business Review (HBR) is reporting on research by Matthew G. Nagler of the City College of New York which found, perhaps surprisingly, that a 5% increase in the average level of agreement with the statement "most people are honest" within a U.S. state results in a decline in traffic fatalities in that state by about 11%. The “most people are honest” statement is a measure of trust in others that is an indicator of the state's level of social capital, sometimes defined as a willingness to engage in community activities. Less-conscientious people who reject civic engagement presumably drive more recklessly, HBR reported.

Nagler’s abstract for the researchCarAccidentSafety_main_022, to be published next month in the journal Economic Inquiry, explains thatevidence that social capital reduces traffic accidents and related death and injury, using data from a 10‐year panel of 48 U.S. states show that social capital has a statistically significant and sizable negative effect on crashes, traffic fatalities, serious traffic injuries, and pedestrian fatalities that holds up across a range of specifications.”

In case you were wondering, Nagler – an Associate Professor in the Department of Economics - did not want the research unduly impacted by snow-related accidents, so he used only data from summer months.  The research data used was from 1997 to 2006. His research paper is entitled “Does Social Capital Promote Safety on the Roads?”

The death toll in the U.S. from traffic accidents has been approximately 43,000 deaths annually, according to the report. Traffic fatalities remain a major cause of death at all ages and the leading cause for persons under the age of 44.

In the paper’s conclusion, Nagler notes that the results of his study “parallel prior findings with respect to social capital’s beneficial effects on economic growth and various health outcomes.”  In 2004, a study by three University of Connecticut researchers found that social capital is associated with decreased risk of hunger.“Households may have similarly limited financial or food resources, but households with higher levels of social capital are less likely to experience hunger,” they concluded.

Moving Vans Heading Outbound, Beyond Connecticut’s Borders

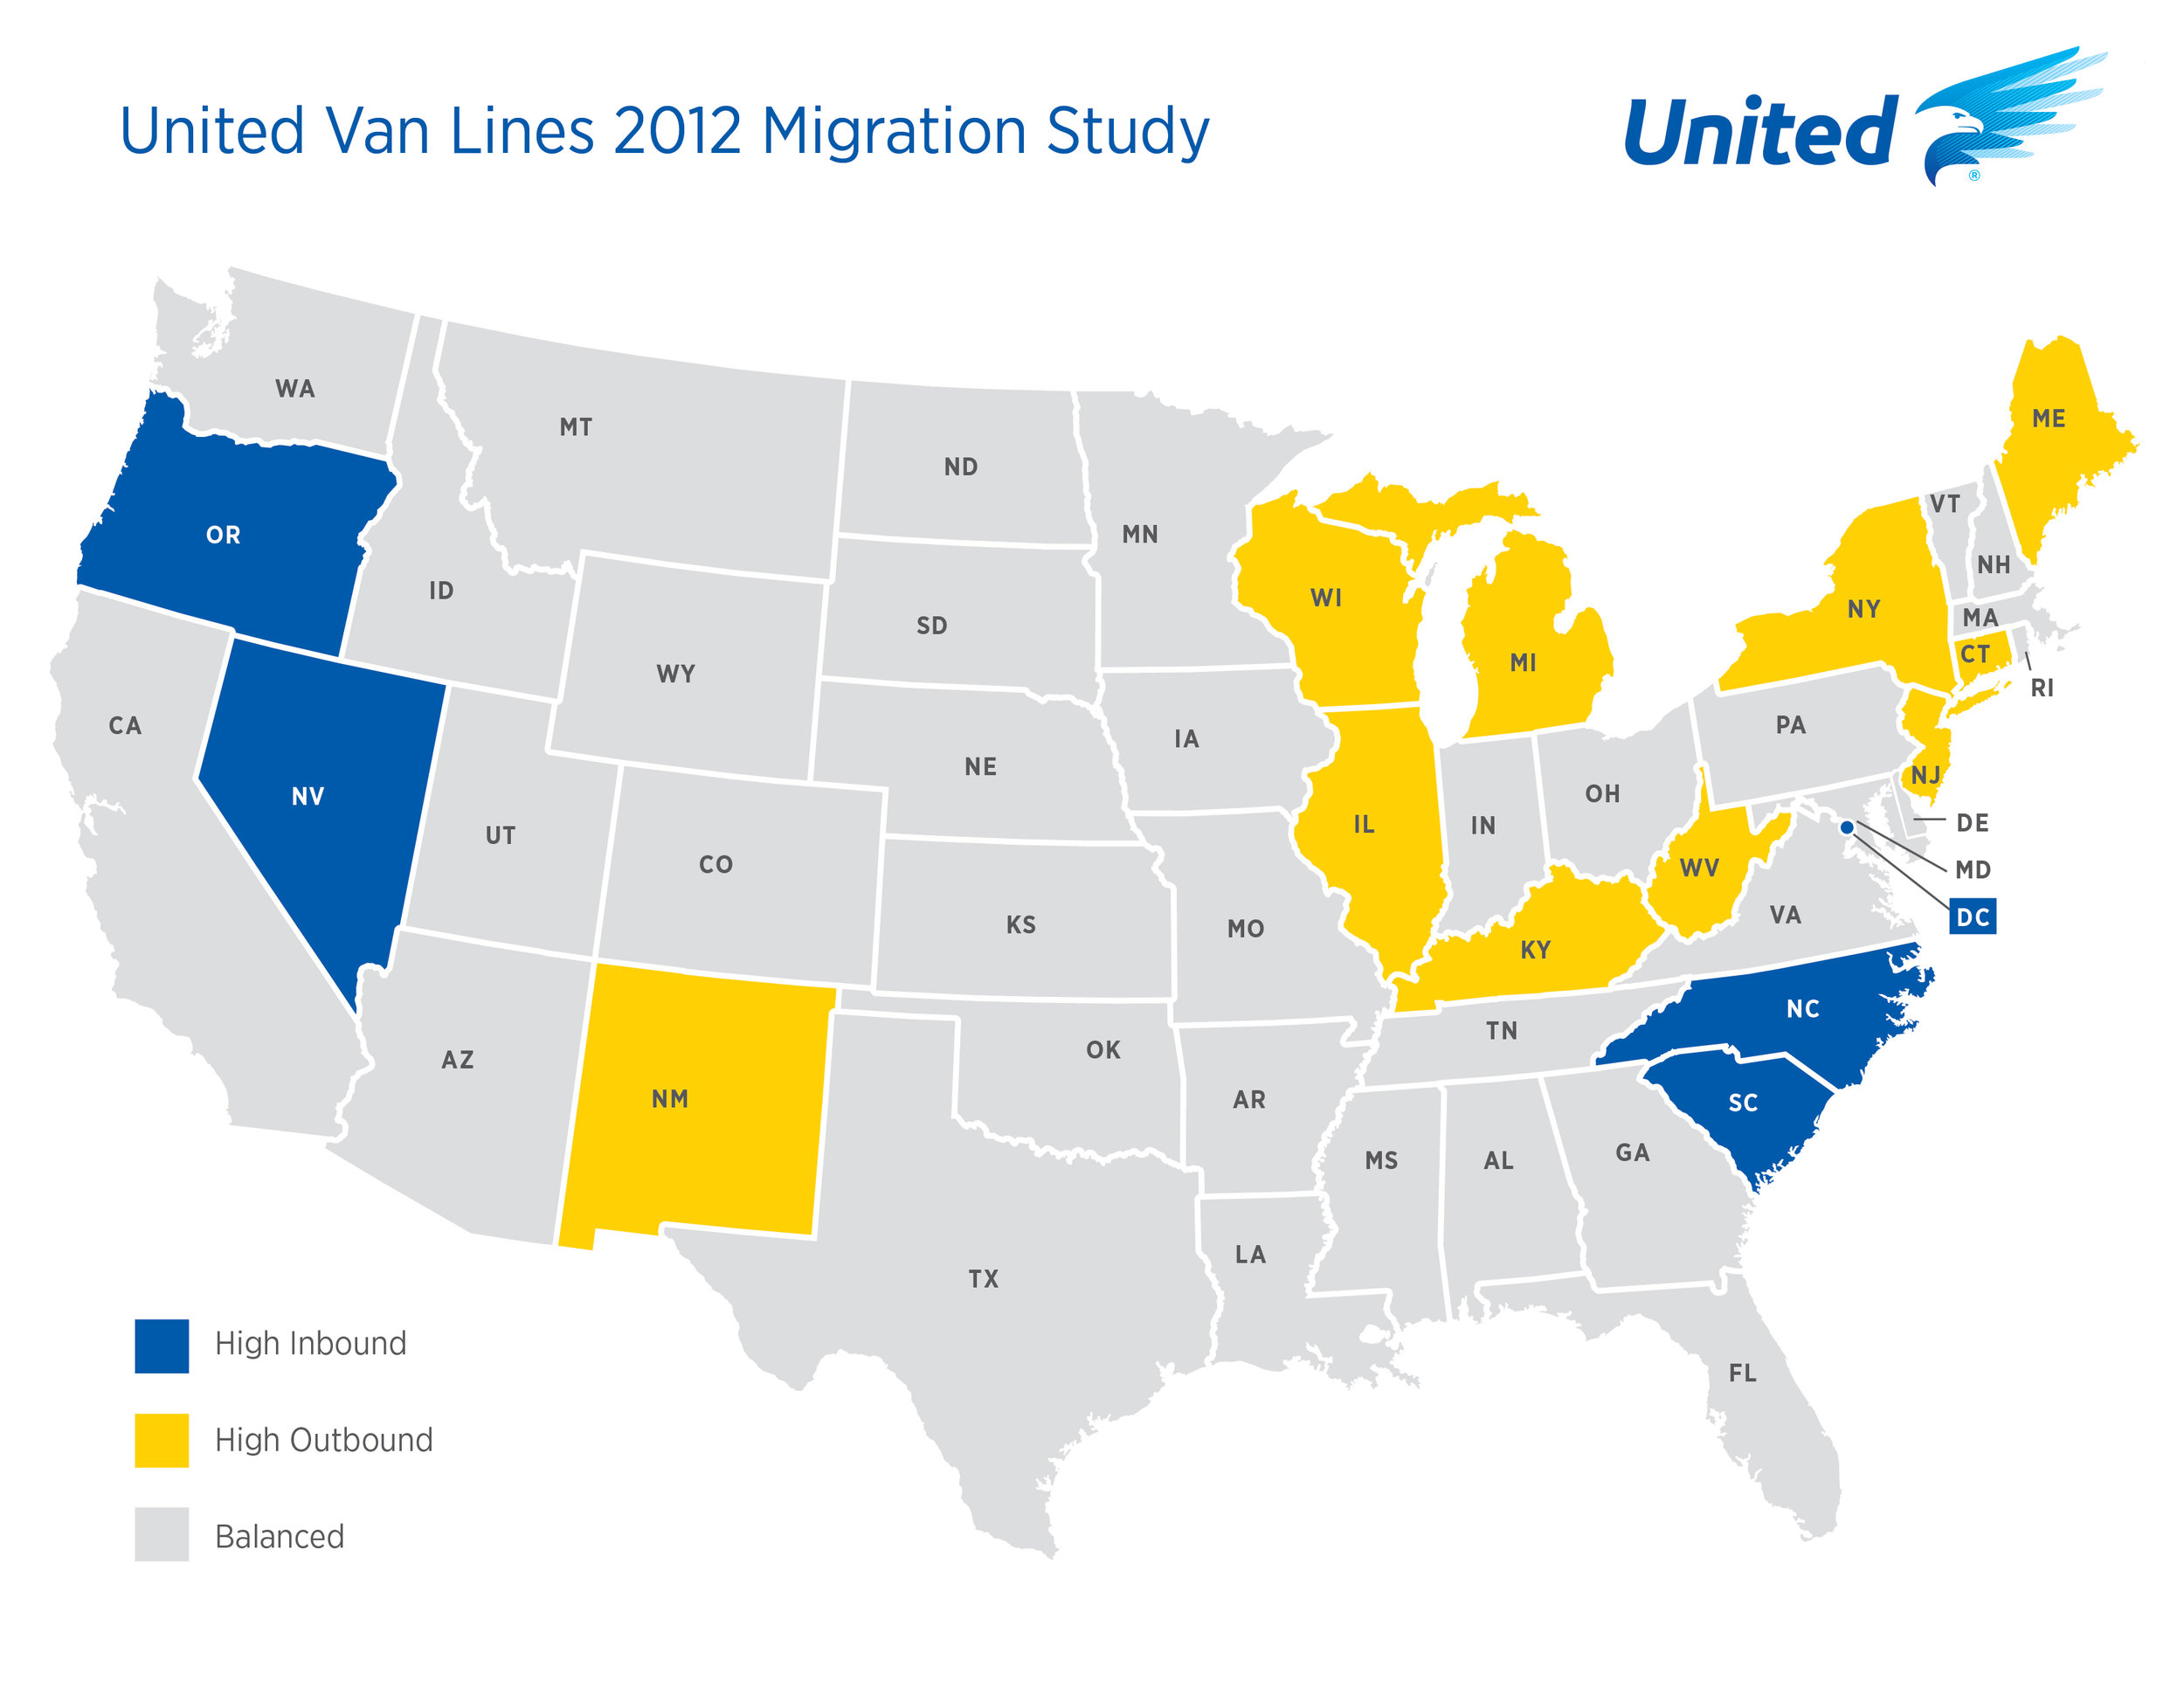
If it’s tough to tell sometimes if you’re coming or going, there is at least one well-known company that keeps close tabs on movement.  United Van Lines, long in the business of moving people from point A to point B, issues an annual “migration study” that tracks where people are moving to, and moving from. In 2012, more folks were going than coming to Connecticut, by a ratio of 56 percent to 44 percent, putting the state squarely among the top 10 outward bound leaders.  The pattern was similar throughout the Northeast.  New Jersey (62 percent) displaced the outbound leader from last year, Illinois (60 percent) reclaiming the top spot for high-outbound migration that it held in 2010.  In addition to New Jersey, New York (58 percent), Maine (56 percent) and Connecticut (56 percent) are also included.

Michigan (58 percent) and Wisconsin (55 percent) along with Illinois represented the Great Lakes region. Michigan fell to the No. 6 from the No. 4 spot it held in 2011. Previously, it had claimed the top outbound spot every year from 2006-2009.  Kentucky (55 percent) joined West Virginia (58 percent) as the only Southern states to appear on the high outbound list. New Mexico (58 percent) was the only Western state to appear on the list. The top 10 outbound states for 2012 were:

  1. New Jersey Migration Map
  2. Illinois
  3. West Virginia
  4. New York
  5. New Mexico
  6. Michigan
  7. Connecticut
  8. Maine
  9. Wisconsin
  10. Kentucky

That’s one list that states would prefer not to be included on.  United has tracked migration patterns  annually on a state-by-state basis since 1977. For 2012, the study is based on all household moves handled by United within the 48 contiguous states and Washington, D.C.  United classifies states as "high inbound" if 55 percent or more of the moves are going into a state and "high outbound" if 55 percent or more moves were coming out of a state or "balanced" if the difference of inbound and outbound is negligible.   The top-five inbound states of 2012 were 1) District of Columbia, 2) Oregon, 3) Nevada, 4) North Carolina and 5) South Carolina.

The Western United States is also represented on the high-inbound list with Oregon (61 percent) and Nevada (58 percent) both making the list. Oregon is number two for inbound migration for the third year in a row. Nevada returned to the high inbound traffic for the second consecutive year. The Carolinas each made the top five with North Carolina at 56 percent and South Carolina at 55 percent inbound moves.

Several states gained approximately the same number of residents as those that left. Those states include New Hampshire from the New England region, and the states of Louisiana, Iowa, Indiana, North Dakota, and Maryland.  This is the fifth consecutive year the District of Columbia (64 percent) was the top moving destination in the United States.  That trend may continue in 2013, what with members of Congress and the Cabinet coming and going.

International Air Travel Connections Drop in Hartford, Jump in New Haven

The Brookings Institute has released data on the flow of international passengers in and out of the largest U.S. metropolitan areas.  The web-based data, drawn from a new report primarily comparing 2003 with 2011, highlights the scale of passenger traffic flows and points to the international markets where these ties are particularly strong. The report, “Global Gateways:  International Aviation in Metropolitan America,” released in October 2012, found that:

  • International air travel in and out of the United States more than doubled between 1990 and 2011. The growth in international passengers during the 21-year period was more than double the growth in domestic passengers and real GDP
  •  Since 2003, international air travel grew between the United States and every global region, with the strongest growth coming from emerging markets.
  • Just 17 metropolitan gateways captured 73 percent of all international passengers starting or ending their trip in the United States as well as 97 percent of all international transfer passengers.
  • As metropolitan economies expand their global reach through trade and investment, international avia­tion plays a pivotal role in the movement of people across national borders.

The national growth was not uniformly reflected in Connecticut.  Of all passengers flying to or from an international destination in Hartford, 17.9% flew direct.  The remainder required connecting flights.  The number of passengers flying internationally thru Hartford dropped from 347,311 in 2003 to 278,997 in 2011, a downward change of nearly 20 percent.  In 2003, Hartford was 40th of 90 airport locations; by 2011 that had dropped to  47th of 90.  The change was a 19.7 percent drop.

By way of comparison, Providence ranked 49th in 2003 in international travelers and 69th in 2011, reflecting a drop in passengers from 187,819 to 126,423, a drop of 32.7 percent.

The numbers for New Haven were considerably smaller, but tell an interesting story nonetheless.  The number of international travelers touching New Haven jumped by 133.5 percent between 2003 and 2011, from 1,645 passengers to 3,841 passengers.  That’s the largest percentage increase of any of the 90 locations in the nation.  In terms of the number of passengers, however, New Haven nudged upward from dead last (90th out of 90) to 89th.

The Brookings data “goes beyond describing where passengers are going and tells us how they get there.”  Using data on transfer points and a map that visualizes each leg of each international route, it paints a portrait of how the global aviation infrastructure rises to meet the demand of international passengers.


East Coast Greenway Charts A Downtown Path in Hartford

You wouldn’t expect to see a sign designating Capitol Avenue in Hartford, on the corner of Sisson Avenue, as the route of the East Coast Greenway – but nonetheless, there it is.  Affixed to a utility pole, not a tree. The East Coast Greenway (ECG) is being established as a 3,000 mile traffic-free (not quite yet) trail that will connect cities and towns from the Canadian border at Calais, Maine to Key West, Florida.  Linking together publicly-owned, firm-surface trails, the ECG is envisioned as a safe route for exercise, recreation and transportation for the 30 million Americans who live near the route and as a tourism destination for millions of visitors.  It includes 15 states (and the District of Columbia), 25 major cities, and scores of smaller cities, towns, villages and counties.

The 198-mile Connecticut section of the East Coast Greenway route shows off the diversity of Connecticut from coast to inland, city to country. The eastern part of the state, sometimes referred to as the “last green valley” is the most rural area in the corridor between Boston and Washington, DC.   A series of rail trails, including the Air Line Trail North and the Hop River Trail, run through this region connecting historic mill towns like Willimantic and pass through forests and farmlands between.

In the western half of the state, the Greenway connects the major cities of Hartford, New Haven, and Stamford and allows users to experience history while touring the Farmington Canal Greenway from Simsbury to New Haven. Southwest of New Haven along Long Island Sound, the interim on-road route hugs the shore through the suburbs to the New York line.

Approximately 28% of the 198-mile route is complete as traffic-free trail, and another 28% is in development. There remains much work ahead,  including the Merritt Parkway Trail, envisioned to parallel the Merritt Parkway in Fairfield County, the Farmington Canal Greenway between Southington and Farmington, and the route from Hartford to Simsbury.

Among the partners working to bring the project to completion in the state of Connecticut are:

This past August, a group of 37 riders traveled from Portland and rode over 400 miles in seven days to Hartford, where they were greeted by Mayor Pedro Segarra.