Report Calls for Transition to Livable Communities Across Connecticut

In Connecticut, more than one-third of the population is over the age of 50, and that proportion continues to increase. Connecticut’s Legislative Commission on Aging has issued “Connecticut for Lireport covervable Communities,” a new report to the state legislature which outlines more than 50 recommendations for communities looking to enhance livability. The Commission has also launched a website which includes a list of communities that are responding to the call for more livable communities, and suggests a wide range of actions that communities can take.

Connecticut is undergoing a permanent and historic transformation in its demographics, the report points out. Between 2010 and 2040, Connecticut’s population of people age 65 and older is projected to grow by 57 pelivability chartrcent, with less than 2 percent growth for people age 20 to 64 during the same period.

Livable communities are vibrant, inter-generational places that are easy to get around, according to the report. “They include affordable, appropriate housing options, supportive community features and services, and adequate mobility options. They foster independence, engage residents in civic and social life, and allow people to age in place. Done well, they benefit community residents across the lifespan.”

The 50-page report indicates that residents born in Connecticut today can expect to live to be 80.8 years old - the third highest life expectancy in the nation. A lengthy series of recommendations are highlighted in seven different areas: community engagement, health and well-being, housing, planning and zoning, safety and preparedness, social and support services, and transportation.

The recommendations include promoting opportunities for intergenerational collaboration, promoting in-home programs that improve health outcomes, creating a balanced transportation system that connects residents with health care services, and adopting policies that encourage incorporation of accessible housing features into new construction. The recommendations also include a call for municipal plans of conservation and development that include planning for older adults and individuals with disabilities to remain in their homes and communities, and building compact, mixed-use development “to encourage walking and eyes on the street.”

Creating livability requires “robust partnerships, long-range planning and sustained commitment.” To support those efforts the Legislative Commission on Aging plans to be:

  • Providing educational opportunities on livable communities for community leaders and other partners in Connecticut;
  • Creating partnerships to support the multi-faceted, multi-disciplinary endeavor of creating livable communities;
  • Supporting, inspiring and incentivizing communities to enhance livability; and developing policies to support aging in place

To help communities implement the recommendations over time, the Commission plans to:

  • Recognize localities that have implemented livable communities initiatives, pursuant to Public Act 14-73 (which established the livable communities initiative)
  • Expand partnerships across multiple sectors to advance livability, logo
  • Continue to convene municipal leaders, legislators and other thought leaders for statewide and regional forums on creating livability;
  • Continue to identify funding opportunities for municipal leaders, seeking to implement or sustain livable communities initiatives;
  • Work with partners to conduct asset mapping across all Connecticut communities, with the goal of helping each community understand its facilitators and barriers to developing livable communities;
  • Continue to research models in other states, nationally and internationally;
  • Work with the Connecticut General Assembly to identify and advance policy solutions that incentivize and inspire the creation of livable communities;
  • Provide technical assistance to Connecticut communities seeking to enhance or promote livability; and
  • Create town-specific data profiles to enable towns to enhance livability in a targeted and strategic fashion.

Among the communities listed on the new website as having best practices in place in parts of their towns or cities are Branford, Guilford, Madison, Bridgeport, Danbury, Darien, Enfield, Hartford, Middletown, New Haven, New Canaan, Norwalk, Seymour, and Torrington.  The Commission plans to proceed with "asset mapping across all Connecticut communities" and "continue to identify innovations, ideas, and best practices for implementing livability in the state. "

Simsbury, New Haven, New Britain Top Bike- and Walk-Friendly Towns in State

As part of a new "complete streets" initiative that began earlier this year, Bike Walk Connecticut has developed a first-of-its-kind ranking of the state's cities and towns on how bike- and walk-friendly they are. The results paint a varied picture of smaller communities and major cities taking effective steps to earn the designation bike- and walk- friendly. Connecticut’s top ten include: Simsbury (1), New Haven (2), New Britain (3), Glastonbury (4), Middletown (5), Canton (6), Weston (7), Hamden (8), Plainville (9) and South Windsor (10). city_biking_sign

The scorecard and rankings of the most bike- and walk-friendly communities are based on an online, statewide public opinion survey that ran this spring and was open to anyone who lives or works in Connecticut.

The rankings are also based on municipal leadership and engagement efforts -- whether cities or towns have bicycle and pedestrian master plans; citizen task forces or advisory groups; complete streets policies; and whether they have conducted any public outreach efforts related to cycling, walking or complete streets.

Plans are for the surveys and scorecard to be conducted annually as part of Bike Walk Connecticut's new five-year initiative to make it safer and estreetsasier to walk and bike by implementing "complete streets" in cities and towns across Connecticut. Complete streets make it easier and safer for people to get around on foot or by bike, in order to become more physically active.

"We want this project to encourage cities and towns to take a really robust approach to complete streets and being bike- and walk-friendly,” said Kelly Kennedy, Executive Director of Bike Walk Connecticut. “Being able to get around safely by bike or on foot isn't just a fad or a health issue or environmental issue. It's an economic development issue.”

Rounding osimsburyut the top 25 towns in Connecticut in the survey were 11. Coventry, 12. Torrington, 13. Meriden, Milford, 15. Hartford, Manchester, 17. Stonington, 18. Old Saybrook, 19. Southbury, 20. Colchester, Somers.

Bike Walk Connecticut has also started to develop an online repository for complete streets resources. The entire project is made possible through the financial support of the Connecticut Department of Public Health through Cooperative Agreement 1305 from the Centers for Disease Control and Prevention (CDC), the purpose of which is to promote statewide implementation of policies and actions to promote health and prevent and control chronic diseases.

Serious Health Issues Faced by State's Asian Pacific American Residents, New Study Reveals

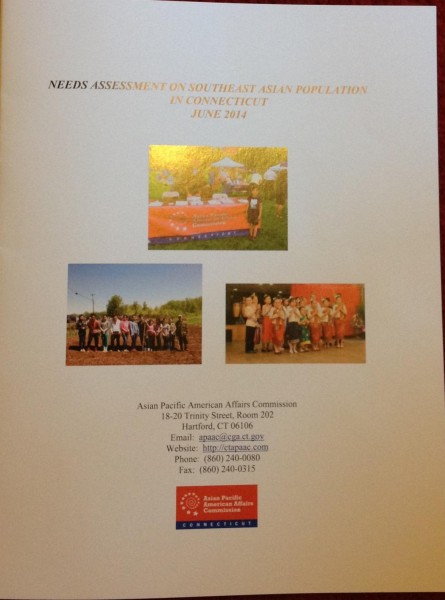
Stereotypes about a thriving and problem-free Asian Pacific population in Connecticut are just plain wrong, according to a new statewide Needs Assessment Study which reveals “high rates of physical and mental health problems” and serious concerns about access to proper food and healthcare, often exacerbated by communication breakdowns  and language barriers." The 21-page study, by the Connecticut Asian Pacific American Affairs Commission, is said to be the first of its kind in Connecticut.  The 2010 U.S. Census reported APA’s as one of the fastest growing minority populations, growing from 2.4 percent of Connecticut’s population in 2000 to 4.4 percent by 2010. The Census projects a steady increase of the APA population through 2050.

The Needs Assessment was developed in collaboration with three community-based organizations: the Khmer Health Advocates, Lao Association of Connecticut aapacc_logo5-300x151nd Connecticut Coalition of Mutual Assistance Associations. The project was also supported by the Asian American Studies Institute at UConn, the UConn School of Pharmacy and the UConn School of Social Work. It focused on housing, education, language access, employment, access to public resources, and medical and mental health.

More than 300 Southeast Asian Connecticut residents – all over age 18 - participated in the study, include just over one hundred from each of three ethnic groups: Cambodian, Lao, and Vietnamese. The study found clear distinctions between the populations in Connecticut, and researchers stressed that viewing the Asian Pacific American (APA) population in the state as one block of people does a disservice to them, and does not adequately respond to their needs.

Food Insecurity

Food insecurity was a “prominent problem,” according to the report. “Close to half reported that they often or sometimes couldn’t afford to eat balanced meals and 43 percent indicated that their food supplies ran out The survey also reviewed “several measures of food insecurity” and found “significant association” between the ethnic groups and “finding it too expensive to have a balanced meal often or sometimes,” as well as “going hungry for lack of sufficient money for food.”

The report also indicated that “all of the ethnic groups reported concern that some members of their community were socially isolated. In particular, they reported that those age 50 and older were most at risk for isolation.”

capitolHealthcare Concerns

Regarding healthcare, “nearly half experienced at least some difficulty in getting the healthcare they believed they needed,” the report indicated. In addition, “more than half of all participants reported experiencing a language barrier with their physician, and for those that needed an interpreter, 59 percent indicated that a professional interpreter was never or rarely available for healthcare visits.”

In regards to Southeast Asian Refugees, the report noted "chronic mental and physical health conditions follwoing a history of severe trauma," adding that "it is vital that primary care physicians and others treating these individuals screen for a wide range of physical health conditions as well as PTSD and depression."  At a State Capitol news conference releasing the report, Dr. Megan Berthold, Assistant Professor in the UConn School of Social Work, said that there is an "urgent need" to address these concerns, adding that the lack of communication can be "dangerous" and could "lead to misdiagnosis."

Among those who received prescriptions, nearly one-third said they did not fill it due to the expense, and among all surveyed, 17 percent “did not see a doctor when they felt they need to” during the past year due to the high cost.

Among the ethnic differences, a greater number of Vietnamese are smokers, Cambodians were “significantly more likely to be diagnosed with PTSD and depression,” and the Lao community indicating the least frequency of language barriers with physicians. Overall, however, the report indicated that “these communities continue to be underserved due to the limited to no resources available to focus on the cultural and linguistic needs of their communities.”

Numerous Recommendations

Included in the recommendations, the study report states that “service providers, state agencies and stakeholders are encouraged to partner with APA communities” in multiple ways, and calls for additional research that “can advance the needs of the APA population.” The series of 14 recommendations include greater training anreportd education, promoting preventative care, actively recruiting APA members in various professional fields, creating diversity in the workforce, translating materials into the most common APA languages, and raising awareness among the APA population regarding their rights.

It is hoped that Needs Assessment studies can focus on other APA ethnic groups, such as the Indian and Chinese communities, in future years. The APA population in Connecticut includes approximately 50 ethnic groups, sharing some similarities and having great diversity. As the initial study demonstrated, specific needs may vary – an important fact for policy makers and those working with this fast-growing aspect of the state’s population.

Among those commenting on the report during the news conference were Secretary of the State Denise Merrill, who was instrumental in the establishment of the Commission when she was House Majority Leader in the legislature, Marie Spivey, Chair of the State Commission on Health Equity, Tanya Hughes, Executive Director of the state's Commission on Human Rights and Opportunities, and Dr. William Howe, Chair of the Asian Pacific American Affairs Commission (see photo, at left). Theanvy Kuoch, Executive Directo of Khmer Health Advocates, noted that "working together we can improve outcomes for our community members while engaging them in their own care.  We have evidence that this approach also saves health care dollars."

The Asian Pacific American Affairs Commission was created in 2008 by an act of the Connecticut legislature.  The 21 member bipartisan commission oversees matters concerning hte Asian Pacific American population in Connecticut, and makes recommendations to the General Assembly and the Governor on the health, safety, education ,economic self-sufficiency and efforts to remain free of discrimination within the APA population in the state.

Efforts to Connect Entrepreneurs Hit the Road Statewide

Some have suggested that the road back for Connecticut’s economy will be built one entrepreneur at a time. If that is the key to an economic rebound, an initiative by New Haven-based company Independent Software is looking to ramp up the process by gathering entrepreneurs in bunches. In fact, New Haven will be the next stop on eight-month Whiteboard Startup Roadshow tour across Connecticut, in the midst of the city’s celebrated International Festival of Arts and Ideas this week. Organizers indicate that cities like New Halogo whiteboardven are “overflowing with impossible ideas and the people who make them happen. We believe connecting to all three -- the place, the thinking, and the people -- can increase the probability of success for others who have impossible ideas.”

On Thursday June 26, from 2-5pm, The Whiteboard is bringing together New Haven area innovators and entrepreneurs for “a little history and to talk about the future.” The “Roadshow” stopped in Hartford last month, with a well-attended program at the reSET co-working space downtown.

Following the Arts and Ideas' "Innovation in the Ninth Square" walking tour of The Grove, SeeClickFix, and MakeHaven, individuals are asked to gather at Luck and Levity for an Open House and Entrepreneur Showcase beginning at 2 PM, followed at 4 PM by perspectives offered by:

  • Margaret Anne Tockarshewsky, New Haven Museum
  • Elon Boms, Launch Capital
  • Jim Gregory, Core Informatics

The Whiteboard - and the The Whiteboard Start-Up Roadshow – is operated by Independent Software, which runs from The Grove co-working space in New Haven, and is supported by CT Next.

Following a kickoff event in New Haven on April 1, the tour moved on to Stamford in April, then to Hartford in May, back to New Haven this week. In eight months’ time, organizers “expect to have a treasure trove of stories from each region and to see a larger, stronger, and more connected startup community state-wide.”  The list of cities to be visited for gatherings of local entrepreneurs is below.  whiteboard_logoheader1

Independent Software works with early-stage entrepreneurs “to develop the products, talent, and community they need to thrive.” The company also provides access to Connecticut’s vast startup community through The Whiteboard, which includes a diverse network of entrepreneurs, investors, and supporters.  The Whiteboard website outlines the Roadshow cities on the calendar:

  • July: Bridgeport-Fairfield: In the context of the city’s own summer arts festival, we’ll shine a light on the amazing progress Bridgeport’s entrepreneurial scene has made in recent years, working closely with the B:Hive, the Business Council of Fairfield County and others.
  • August: New London-Norwich: SECT Tech Center at Avery Point for bioscience startups and a robust arts scene makes the shoreline a unique place to start a business. Along with the New London-Groton area, Norwich is new territory for us so this area will be true exploration.
  • September: Storrs-Windham: From incubators to partnerships with UTC and others, UConn Storrs is a hub of activity for a myriad of innovation startups. Windham’s history, arts and social entrepreneurship adds to the mix for this not-so-quiet corner of the state.
  • October: Danbury-Waterbury: The Danbury Hacker Space is launching this year, and it’s just the beginning of activity for their entrepreneurs. As one of Connecticut’s many factory towns, Waterbury is looking to leverage its buildings to help launch small businesses.
  • November: Middletown-Meriden: As a connection point between the shore and Hartford, this area has pockets of innovation that you wouldn’t suspect. We hear rumblings of a startup culture and look forward to unearthing what’s here.
  • December: Torrington: Litchfield County is known for its organic farming and getaways. Yet, Torrington’s Warner Theater and energetic young politicians are fighting hard to be heard. We look forward to bringing these hidden gems to you.


Aging Bridges, Considerable Disrepair Are Significant Challenge in CT, Nationwide

It was in 1983 that three people died in Connecticut when a section of the Mianus River Bridge on Interstate-95 collapsed into the water below, and unsuspecting drivers drove off the end of the road in the middle of the Greenwich night. That tragedy launched a multi-million dollar infrastructure investment program in Connecticut, but now, three decades later, the age and condition of the state’s bridges is front and center again, as a poorly functioning, 118-year-old railroad bridge has disrupted commuter service on the nation’s busiest rail corridor by repeatedly refusing to close. Mianus River Bridge I95

The extent of the nation’s bridge-related challenge is daunting, and yet represents only a portion of the overall infrastructure needs. Less than a year ago, a study released by the American Society of Civil Engineers determined that:

  • over two hundred million trips are taken daily across deficient bridges in the nation’s 102 largest metropolitan regions
  • one in nine of the nation’s bridges are rated as structurally deficient,
  • the average age of the nation’s 607,380 bridges is currently 42 years.

The report also pointed out that “it is of growing concern that the bridges in our nation’s metropolitan areas, which are an indispensable link for both millions of commuters and freight on a daily basis, are decaying more rapidly than our rural bridges.”

bridgesCTOnce every four years, America’s civil engineers provide a comprehensive assessment of the nation’s major infrastructure categories in ASCE’s Report Card for America’s Infrastructure (Report Card). The most recent report was issued in 2013.

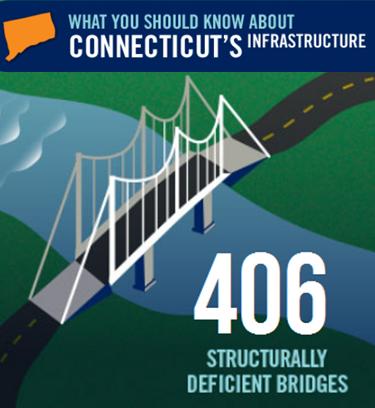
Connecticut, according to the data, has 406 of the state’s 4,208 bridges classified as structurally deficient and another 1,070 are considered to be functionally obsolete. The report also noted that Connecticut has 21,407 public road miles, and 73 percent of the state’s major roads are considered to be in poor or mediocre condition.

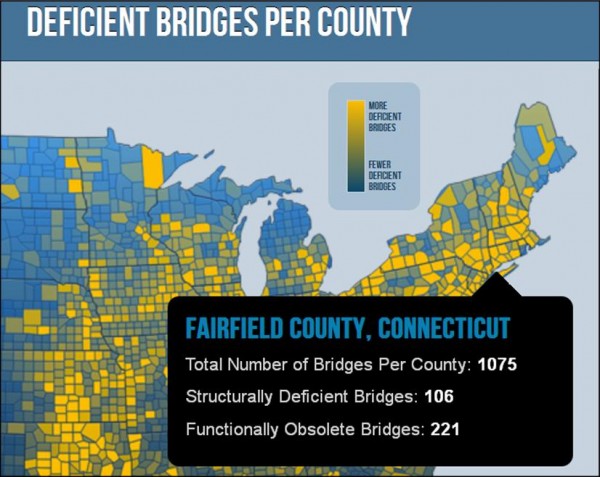
By county, the 406 structurally deficient bridges were: 106 in Fairfield County, 71 in Hartford County, 58 in New Haven County, 45 in New London County and Litchfield County, 27 in Middlesex County, 24 in Windham County and 14 in Tolland County. In addition, the report indicated that Connecticut had 1,023 functionally obsolete bridges in the state.

Structurally deficient bridges “require significant maintenance, rehabilitation, or replacement. These bridges, according to the report, “must be inspected at least every year since critical load-carrying elements were found to be in poor condition due to deterioration or damage.” Functionally obsolete bridges are those that “no longer meet the current standards that are used today. Examples are narrow lanes or low load-carrying capacity.” fairfield bridges

The Federal Highway Administration (FHWA) estimates that to eliminate the nation’s bridge deficient backlog by 2028, an investment of $20.5 billion annually would be needed, according to the report, while only $12.8 billion is being spent currently. The report stated that “the challenge for federal, state, and local governments is to increase bridge investments by $8 billion annually to address the identified $76 billion in needs for deficient bridges across the United States.”

The report indicated that 22 states have a higher percentage of structurally deficient bridges than the national average, while five states have more than 20% of their bridges defined as structurally deficient. Pennsylvania tops the list with 24.4%, while Iowa and Oklahoma are not far behind, each having just over 21% of their bridges classified as structurally deficient.

Overall, the nation’s grade for the condition of its bridges was C+, which was described as “mediocre” and in need of attention. “Some elements exhibit significant deficiencies in conditions and functionality, with increasing vulnerability to risk.” The 32-member Advisory Committee did not include any engineers from Connecticut, but did include two from Massachusetts and one from Maine, among the New England states.

Time magazine reported this week that the I-95 bridge over Delaware’s Christina River was quickly closed to all traffic on May 29, after “an engineer who happened to be working nearby noticed two of the span’s support pillars tilting.“ Officials hope to have the structure stabilized and reopened by Labor Day. The bridge had routinely handled about 90,000 vehicles per day.

The I-35W bridge over the Mississippi in Minneapolis collapsed during rush hour on August 1, 2007, plunging dozens of cars and their occupants into the river, killing 13 people and injuring 145. The bridge was Minnesota's fifth busiest, carrying 140,000 vehicles daily.asce-logo

The American Society of Civil Engineers, founded in 1852, is the country’s oldest national civil engineering organization. It represents more than 140,000 civil engineers in private practice, government, industry, and academia who are dedicated to advancing the science and profession of civil engineering. The first Report Card for America’s Infrastructure was issued in 1988.

France Replaces Canada As #1 Nation for Connecticut Exports in 2013

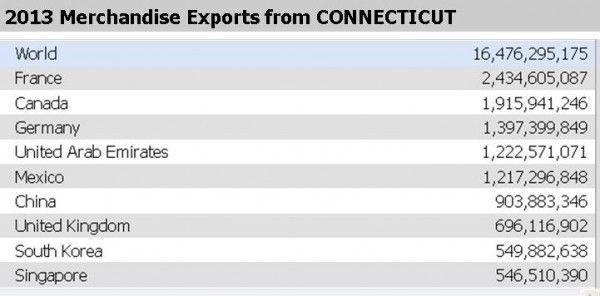
France replaced Canada as Connecticut’s top export partner in 2013.  Exports to France jumped from 1.9 billion to 2.4 billion, compared with the previous year, while exports from Connecticut to Canada remained steady at 1.9 billion.  During 2013, France received 14.8 percent of the state’s exports, while Canada received 11.6 percent, according to data from the U.S. Department of Commerce.

Germany (1.4 billion), United Arab Emirates (1.2 billion) and Mexico ($1.2 billion) round out Connecticut’s top five for 2013.  Germany also ranked third in 2012.   In 2013, UAE edged Mexico for fourth place among Connecticut’s leading export recipients, the reverse of their standing the previous year.    export chart

Overall, shipments of merchandise from Connecticut in 2013 totaled $16.5 billion, according to data from the Department of Commerce’s International Trade Administration – an increase of 3.2 percent from the previous year.  Connecticut was one of 16 states setting annual export records.  Exports were 15.9 billion a year ago, which was a drop from 16.2 billion in 2011 and 16.0 billion in 2010.

exportsOverall, the European Union was Connecticut’s largest export market, with average exports (2011-2013) totaling $6 billion annually, the agency’s report noted.
The state's largest merchandise export category is Transportation Equipment, which accounted for $8.0 billion of Connecticut's total merchandise exports in 2013, a category dominated by civilian aircraft, engines and parts, according to Commerce Department data. Other top merchandise exports are Machinery, Except Electrical ($1.9billion), Computer & Electronic Products ($1.3billion), Chemicals ($998 million), and Electrical Equipment, Appliances & Components ($760 million).

After the top five, Connecticut’s export recipients, in order, are China, United Kingdom, South Korea, Singapore, Japan, Netherlands, Brazil, Malaysia, Qatar and Turkey, rounding out the top 15.

In a year-to-year comparison of 2013 to 2012, exports to France increased by a substantial 27 percent, to Singapore by 13.6 percent and to the UAE by 12.3 percent.  Exports to Columbia jumped 232 percent, from $66 million to $219 million.  Exports dropped slightly to Japan, China, Malaysia and the Netherlands.

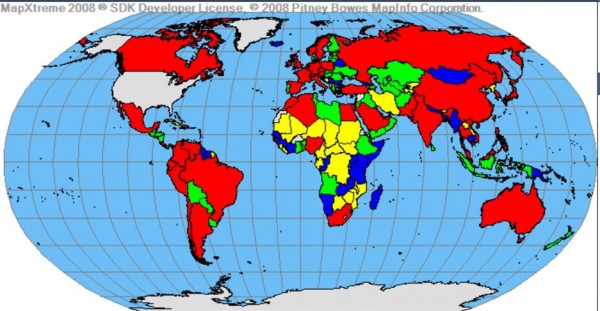
The United States currently has free trade export mapagreements in force with 20 countries, which account for $5.0 billion (30 percent) of Connecticut’s exports. During the past 10 years, exports from Connecticut to these markets grew by 69 percent, with NAFTA, Korea, Singapore, Colombia, and Israel showing the largest dollar growth during this period, the agency reported.
Connecticut’s goods exports to all Trans-Pacific Partnership markets increased by 9 percent from 2011 to 2013. During this period, 29 percent of Connecticut’s total goods exports went to the TPP nations, which include Australia, Brunei, Canada, Chile, Japan, Malaysia, Mexico, New Zealand, Peru, Singapore and Vietnam.  In 2013, 44 percent of total U.S. exports went to TPP nations, where the U.S. has focused on “creating a high standard, regional agreement that opens new markets and knits together existing U.S. trade agreements,” according to the agency’s update report.

The U.S. set an all-time record 2.3 trillion in exports in 2013.  Joining Connecticut in reaching state export records (see interactive map) were Texas, California, Washington, Louisiana, Michigan, Ohio, Georgia, Tennessee, North Carolina, South Carolina, Kentucky, Mississippi, Maryland, Colorado and Oklahoma.

Over one-quarter (27.4 percent) of all manufacturing workers in Connecticut depended on exports for their jobs, according to 2011, the most recent available in that category.  A total of 6,020 companies exported from Connecticut locations in 2011. Of those, 5,357(89.0percent) were small and medium-sized enterprises with fewer than 500 employees. Small and medium-sized firms generated over one quarter (26.6percent) of Connecticut's total exports of merchandise in 2011.


CT Ranks #30 in Motorcycles Per Capita; Helmets Not Required

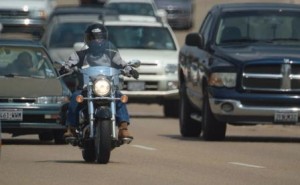
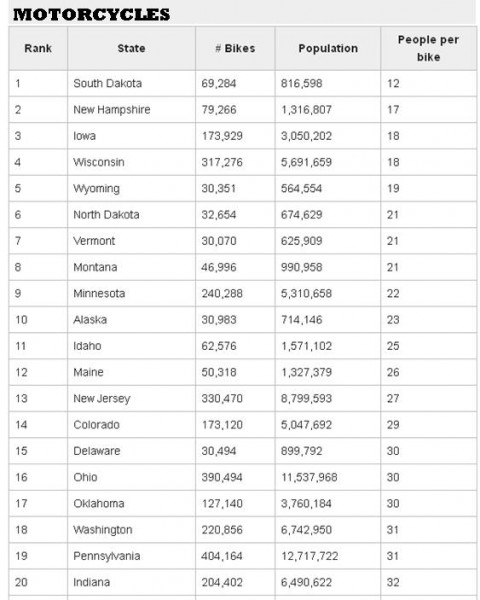
Which states have the most motorcycles per capita?  The top three are South Dakota, New Hampshire (Live Free or Die!) and Iowa. Connecticut – the Land of Steady Habits – rides in at number 30 among the states.

South Dakota comes in first with 12 people for every motorcycle, besting the national average by 66 percent, according to data compiled by the website The Motley Fool.  The state had 69,284 motorcycles registered, repmotorcycle-300x185resenting 0.82 percent of all motorcycles in America. South Dakota is home of the annual Sturgis Motorcycle Rally, which attracted 467,338 riders in 2013.  

According to the most recent report by the U.S. Department of Transportation, there were 8,410,255 motorcycles registered nationwide by private citizens and commercial organizations, according to the most recent annual data, from 2011. That represents one motorcycle owner out of every 36 people.30

Connecticut ranked #30 on the list of states, with 97,960 motorcycles, representing 36 people for every motorcycle.  Reaching the top fifteen states were New Hampshire, Iowa, Wisconsin, Wyoming, North Dakota, Vermont, Montana, Minnesota, Alaska, Idaho, Maine, New Jersey Colorado and Delaware.

New Hampshire placed second with 17 peomotorcyclesple for every motorcycle beating the national average by 53 percent.  The state had 79,266 motorcycles registered, representing 0.94 percent of all motorcycles in America,.    The state is also home to Laconia Motorcycle Week, which dates back to the early 1900s and is one of the country’s oldest rallies.

New Hampshire also is one of 31 states without a mandatory helmet law. In Connecticut, motorcycle operators between 16 and 17 years old must wear a helmet. Drivers over 18 are required to wear a helmet if they only have a motorcycle permit, and not a motorcycle license. Drivers of all ages must wear protective eyewear, such as goggles or glasses, unless the cycle is equipped with a windshield.

States with the least motorcycles per capita are Mississippi, Louisiana, Texas, New York, Georgia, Maryland, Utah and California. 

The state with the most motorcycles is California with 801,803, followed by Florida, with 574,176, Texas with 438,551, Pennsylvania with 404,164, Ohio with 390,494,  New York with 345,816 and  New Jersey with 330,470.

Currently, about half the states require helmets for all motorcyclists, according to the Governor’s Highway Safety Administration.  As outlined above, boost other states require helmets for certain riders, and a few have no helmet law.

  • 47 states and the District of Columbia have a helmet law effecting at least some motorcyclists.
    • 19 states and the District of Columbia have a universal helmet law, requiring helmets for all riders.
    • 28 states require helmets for specific riders.
  • 3 states (Illinois, Iowa and New Hampshire) do not have a motorcycle helmet law.

In 1967, the federal government required states to enact universal motorcycle helmet laws to qualify for certain highway safety funds, the website noted.. By 1975, all but three had complied. In 1976, Congress revoked federal authority to assess penalties for noncompliance, and states began to weaken helmet laws to apply only to young or novice riders.

Passenger Traffic Gaining Altitude At Bradley - Gradually

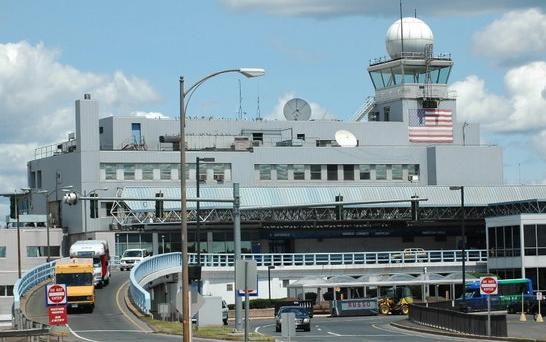
Flying high?  Well, sort of.  Bradley International Airport reports an increase of 1 percent in passenger counts for 2013, including four consecutive months of growth at the end of the year.

The Connecticut Airport Authority assumed oversight of Bradley in July from the state Department of Transportation.  That effectuating Gov. Malloy’s proposal, approved by the state legislature two years ago, for a new quasi-state agency that would be more responsive to market opportunities and less grounded in the state’s bureaucratic procedures.

The numbers increased 1 percent in September, 4 percent in October, 3 percent in November, and a lofty 20 percent in December, the Hartford Business Journal reported.  The overall count of passengers getting on and off planes at Bradley was 5,421,875 in 2013, compared to 5,381,860 in 2012.

Looking slightlBradleyy farther back, in 2009 the total was 5,334,322.  The Bradley International Airport Strategic Plan for 2010-2013, prepared in 2009, anticipated 6,545,000 enplanements and deplanements in 2013 – about 125,000 more that the actual totals.  At that time, an annual average growth rate of 6.2 percent was projected.  The same report called for additional growth in passengers of 3.4 percent annually for 2013 – 2018.  The projections were provided in the InterVISTAS report, Bradley International Air Traffic Forecasts – Final Report, dated April 25, 2010.
So much for predictions.

Bradley continued its end-of-year growth pattern at the start of 2014, with passenger counts increasing 9 percent in January.  There is, however, a long way to go to achieve the numbers projected years ago, which are necessary to come within range of what’s needed to bring plans for a new terminal off the drawing boards and into construction.

Earlier this year, it was reported that if passenger counts increase as currently projected, and other conditions are realized, construction of a new Terminal B would tentatively begin in just under a decade, in 2022. The entire complex, with the additional new terminal, would be up and running by about 2024 at the earliest.  Picture2

Before that threshold is reached – which remains uncertain – plans are to proceed with roadway realignment, scheduled to start in late 2015 or early 2016, with completion in late 2017 or early 2018.  That would include a rotary to be built where the Route 20 connector, off Interstate 91 Exit 40, to the garage’s exit road, and a new access road to a newly constructed transportation center.

The elevated road in front of Terminal A just past the Sheraton would remain, then all upper level traffic would be diverted to the lower level. The elevated roadway in front of Terminal B will be demolished.

That would make space for a new ground transportation center, which is expected to have a rental car facility, about 800 public parking spaces and a transit center with curbside services for limousines, taxis, and buses.  Just about anyone driving past the old, rusting and vacant terminal eagerly anticipates its demolition, as much as the array of new services that are planned to replace it.

Fifth Time A Charm? Vulnerable User Bill Back Before Legislature

“Study after study reveals that more people would be willing to make more trips by bike or on foot if they felt they could do so without taking their lives in their hands.”  That comment at a legislative hearing by Kelly Kennedy, Executive Director of Bike Walk Connecticut, highlights the reason behind proposed legislation that would “help hold accountable careless drives who injure or kill non-motorized users of the road.”

Dubbed the “don’t hit me” bill, it is baambulance_ck for a fifth consecutive year at the State Capitol, endorsed by an array of 23 organizations.  In each of the past two years, it passed the Senate but was not considered by the House.  It recognizes that “vulnerable road users,” such as pedestrians, bicyclists, first responders, and highway workers need additional legal protections, and provides enhanced penalties for careless driving resulting in injury or death of a vulnerable road user.

The "Vulnerable User" bill:

  • Provides for a fine of up to $1,000 for injuring or killing a vulnerable user due to careless driving; and
  • Defines a vulnerable user as a pedestrian; cyclist; animal rider or driver; highway worker; farm tractor driver; user of a skateboard, roller or inline skates; user of a wheelchair or motorized chair; or blind person and his or her service animal.

The statistics behind the effort are clear:

  • Careless drivers injure hundreds of people every year in Connecticut--130 pedestrians and cyclists were killed between 2010 and 2012 and approximately 1,400 pedestrians and cyclists are injured every year, according to Bike Walk Connecticut.  Between 2006 and 2012, there were more than 10,000 deaths or injuries.
  • The League of American Bicyclists' top recommendation for Connecticut in its Bike Friendly State Report Card calls for Connecticut to "Adopt a vulnerable road user law that increases penalties for a motorist that injures or kills a bicyclist or pedestrian."  (CT's Bike Friendly State ranking was #18 in 2013.)

Nora Duncan, State Director of the Connecticut AARP, testified in support of the bill, noting that “an older pedestrian is 61 percent more likely to die from a crash than a younger pedestrian.”  The bill, she said, “could improve pedestrian safety by deterring negligent behavior that puts vulnerable uses at risk of injury or death.”  In a survey, 47 percent of people over age 50 in Connecticut said they felt they could not safely cross main roads close to their home.

share the roadThe proposal was also supported by the State Department of Transportation, which suggested that the definition “be all encompassing to include all users such as persons on a legal non-motorized device” such as scooters and skateboards.  Transit for Connecticut, a statewide coalition of 33 business, social service, environmental, planning and civic organizations advocating the benefits of mass transit, supported a vulnerable user law indicating that “with emphasis on energy conversation and healthy lifestyles, the number of walkers and bicyclists is growing.  These residents, along with residents living in close proximity to bus stops and transit services need proper access if they want to use public transit.”

Kirsten Bechtel of the Yale School of Medicine’s Department of Pediatric Emergency Medicine, called for individuals who commit an infraction under the proposed law to “attend driver retraining and perform community service.”  In written testimony, she said that “vulnerable user laws in Oregon, Washington and Delaware include these requirements to ensure that drivers are held accountable and operate their vehicles safely in the future.”  Others, including the Tri-State Transportation Campaign, supported that idea.

Clinton resident Debbie Lundgren, in an email to the Transportation Committee, said succinctly, “pass the Vulnerable User Bill this year.  We have waited long enough!”

The  Committee is expected to consider SB 336 later this month.  If approved there, it would go on to the Senate for consideration.  A road well traveled.

Connecticut Ranks #22 in Motor Vehicle Thefts; Rate Drops 3 Percent

Connecticut ranks #22 in the nation in motor vehicle thefts, with 238 thefts per 100,000 registered vehicles, a one-year drop of 3.3 percent, according to the most recent full-year data.

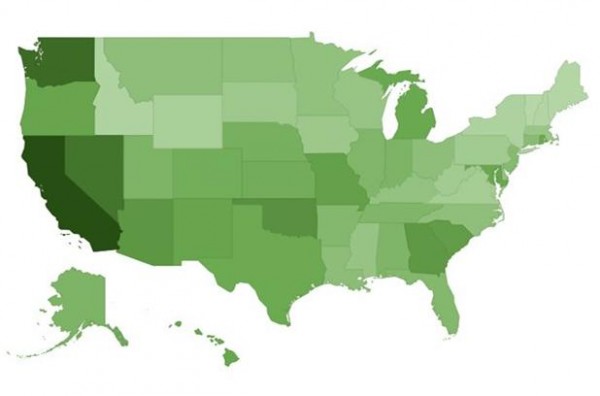
The District of Columbia had the greatest theft rate, with a total of 3,661 vehicles stolen and 322,350 registered vehicles in D.C.  That reflected a reduction in thefts of 18 percent in 2012 as compared with 201auto theft map1, but still outdistanced all 50 states.

Rounding out the top 10 states with the highest rate of car thefts were California, Nevada, Washington, Maryland, Georgia, Arizona, South Carolina and Oklahoma.  Among the New England states, Rhode Island ranked #12, Massachusetts was #34, Maine was #47, New Hampshire was #49 and Vermont was #51, with 435 thefts and 606,941 registered vehicles – the lowest rate in the nation.

In Connecticut in 2012 there were 6,449 motor vehicle thefts.  The state has 2,706,459 registered vehicles.fbi-logo-large

The data was compiled by Bloomberg.com based on information from the Federal Bureau of Investigation (FBI) Uniform Crime Reports, and U.S. Department of Transportation Federal Highway Administration.

According to data compiled by the FBI and provided by the Criminal Justice Information Services Division:

  • There were an estimated 721,053 thefts of motor vehicles nationwide in 2012. The estimated rate of motor vehicle thefts was 229.7 per 100,000 inhabitants, placing Connecticut’s car theft rate  just above the national average.
  • The estimated number of motor vehicle thefts increased 0.6 percent in 2012 when compared with the 2011 estimates, but declined 24.8 percent when compared to the 2008 estimates, and 42.8 percent when compared to the 2003 estimates.
  • More than $4.3 billion was lost nationwide to motor vehicle thefts in 2012. The average dollar loss per stolen vehicle was $6,019.
  • In 2012, of all motor vehicles stolen, 73.9 percent were automobiles.