Museum Store Association Brings National Conference to Hartford; Wadsworth Atheneum Is Award Finalist

The Wadsworth Atheneum’s Museum Store is one of five nominees for the 2015 Museum Store Association (MSA) Visual Merchandising award, which recognizes excellence in visual merchandising by a museum institution. The award will be given on Sunday, April 19 in Hartford – on the final day of the Museum Store Association’s national conference, being held this weekend at the Connecticut Convention Center. Nominations were evaluated based on creative use of resources, collaboration and how well the display extends the museum experience.  The other finalists are the Columbia River Maritime Museum, Fine Arts Museums of San Francisco, Eastern National and Virginia Museum of Fine Art.Balancing-Act-600x175-indd.jpg

The 2015 MSA Retail Conference & Expo, organizers point out, is designed to help nonprofit retail professionals succeed by offering dynamic learning sessions and opportunities to connect with select MSA vendors who offer products matched with the museum store industry.

In Hartford for the annual conference are approximately 300 museum store professionals and more than 200 select vendors who offer products and services for nonprofit and independent retailers. When the conference location in Hartford was announced 15 months ago, it was expected to bring in 900 participants downtown utilizing an estimated 1,130 room nights, according to organizers.

Learning sessions throughout the conference are presented by “the leading thinkers in nonprofit retailing who share the knowledge you need to run your store, meet the needs of management, make the most out of challenges, be a leader and through retailing contribute to your institution’s brand and extend the experience of your visitors.”

It is the first time the national conference is being hosted in Hartford.  In recent years host cities have been Houston, Los Angeles, New Orleans and Chicago.  The national meeting also includes a “retail boot camp” and a tour of the Mark Twain House and Harriet Beecher Stowe House in Hartford.

The outstanding line-up of speakers includes Roderick Buchanan, the director of buying and retail sales at the British Museum Company, where he has overseen the redevelopment of the stores, products and customer service culture and increased profits four-fold since 2008.  Buchanan will deliver the conference opening keynote on Saturday morning.  The closing keynote speaker on Sunday will be Dick Durrance, described as one of the most versatile photographers of his generation. His well-known portfolio includes images from Vietnam combat, National Geographic stories, global advertising campaigns, National Parks and the world’s great golf courses.

Sessions for industry attendees include Open To Buy Workshop, Retail Boot Camp, 7 Habits of Highly Effective Retailers, Sales Guaranteed: The Only Four Things You Need to Know to Improve Museum Store Sales, Perspectives On Fair Trade, 29 Tech Tools to Create Cool Content for Social Media, Looking at Business Through Your Customers’ Eyes and eCommerce A to Z: Selling the Museum Experience Online.

In addition to the Wadsworth Atheneum, other MSA member institutions in the area include the Connecticut Historical Society Museum & Library, Harriet Beecher Stowe House, New Britain Museum of American Art and Friends of Dinosaur State Park and Arboretum. Manager of the Museum Shop at the Wadsworth Atheneum Museum of Art, Stacey Stachow, is immediate past MSA Board President.Hartford-Square

“Retailers often find themselves doing a balancing act every day, performing a variety of functions and responsibilities,” said Jama Rice, MSA Executive Director/CEO. “They balance inventory control, staffing, merchandising, displays, financial management, marketing and even event planning, and at the same time they must stay apprised of all that’s happening at their institutions and stores. The 2015 Conference & Expo will provide tools to help balance the balancing act.”

Now in its 60th year, the Museum Store Association is a nonprofit, international association dedicated to advancing the success of nonprofit retail professionals in extending the brand and contributing to the bottom lines of their institutions. MSA serves over 1,500 members in the U.S., Canada, Mexico, Asia and Europe.

CT Is Second-Tier State in Innovation Ranking of States; Earns Top Grades in Investment, Internet

Connecticut is among the second tier of states, described as an “innovation leader,” in the inaugural Innovation Scorecard compiled by the Consumer Electronics Association (CEA).  The first-of-its-kind innovation performance index is based on ten criteria, and evaluates all 50 states and Washington, D.C., according to the conduciveness of their legal, regulatory and overall business environments to welcome and encourage innovation. The Innovation Scorecard’s first group of Innovation Champions – those states that earned the highest grades – are Delaware, Indiana, Massachusetts, Michigan, North Carolina, South Dakota, Texas, Utah and Virginia, as well as the District of Columbia.CT grades

Connecticut’s grades range from A- in the “attracts investment” and “fast internet” categories to a C in “tax-friendliness,” D in “innovation friendly sustainable policies,” and F in “right to work.”  The state also received a B in four categories:  entrepreneurial activity, tech workforce, grants STEM degrees and innovation momentum.

The analysis notes that in Connecticut, “the public and private sector are funding incubators including the Connecticut Enterprise Center, Institute of Technology & Business Development and UConn Technology incubation Program to help startups launch their businesses and become financially viable companies.”

The Innovation Scorecard assesses the progress of state policies intended to advance innovation and improve business climates, while also tracking states’ responsiveness to disruptive innovation. Using established economic, educational and legislative data, the report issues grades across ten categories, including: right-to-work laws; policies that support new business models; tax friendliness; Internet speed; and size of the tech workforce.

After the innovation champions group that tops the list, the next category (innovation leader) includes Connecticut and 19 other states, including Vermont and New Hampshire in New England and Washington and Oregon on the West Coast.USA

Connecticut is one of only five states to receive an A, A- or A+ in the “attracts investment” category.  The others are California, Washington, Massachusetts, and Delaware.  Nine states and Washington, D.C. receive an A, A- or A+ for “fast internet.”  Among them are Connecticut, New Hampshire, Rhode Island and Massachusetts.

Among the CEA report’s key findings:

  • Delaware leads the nation in providing the fastest average Internet speed, at 16,200 kbps;
  • The District of Columbia leads the nation in tech jobs per capita;
  • Massachusetts and California bring in the most venture capital investment dollars, more than $500 per capita, in the U.S; and
  • Massachusetts, California, Washington, Connecticut and Delaware received higher R&D investment than other states.

Plans are for the Innovation Scorecard will be annually updated to reflect states’ evolving policies and any changes in measuring innovation.

CEAGary Shapiro, president and CEO of CEA, said “The future of growth and economic prosperity in this country is most vibrant in places where policies and political climates serve to unleash the entrepreneurial spirit and can-do attitude that is part of our American DNA. Our hope is that states will use our Scorecard as a measurable guidepost to improve their policies supporting innovation.”

The Consumer Electronics Association (CEA), with more than 2,000 member companies, is the technology trade association representing the $286 billion U.S. consumer electronics industry.

Asian Population Grows in CT and US, Becomes More Suburban As Challenges Persist

Asians are the country’s fastest-growing racial group — their share of the U.S. population has increased from 4.2 percent in 2000 to 5.6 percent in 2010, and is expected to reach at least 8.6 percent by 2050, the website newgeography.com has reported.  The White House has estimated that by 2050, Asian Americans and Pacific Islanders will make up 9.7 percent of the total United States population -- over 40 million people. Between 2000 and 2010, the Asian Pacific American population in Connecticut increased by 65 percent.  Connecticut's current Asian Pacific population is 147,830, four percent of the total Connecticut population, according to the state’s Asian Pacific American Affairs Commission, an agency created by the state legislature in 2008. apacc_logo5

Asia is now the largest source of legal immigrants to the United States, constituting 40 percent of new arrivals in 2013, according to newgeography.com.  The state Commission indicates that Asian Pacific Americans can be broken down into four geographically-based groups:

  • Pacific Islanders, mostly Native Hawaiians, Samoans, and Guamanians;
  • Southeast Asians, largely comprised of Indochinese from Vietnam, Thailand, Cambodia, Laos, and Indonesians and Filipinos;
  • East Asians, including Chinese, Japanese, and Koreans; and
  • South Asians, including those from Bangladesh, Bhutan, India, Pakistan, Nepal, Sri Lanka, Tibet, and the Maldives

In Connecticut, the largest population of Asian Pacific Americans are in Fairfield and Hartford counties, and Asians represent the majority minority in 40 percent of Connecticut school districts, according to Commission data.  Recent data compiled in New Haven indicated that the Elm City’s growth in recent years, and its status as the state’s fastest growing city, has been in large part due to immigrants, including Asians.

mapIn decades past, Asians, as other immigrants, tended to cluster in “gateway cities” and often in the densest urban neighborhoods, like New York’s Chinatown. Now the center of gravity has shifted to the suburbs, newgeography reported.  Between 2000 and 2012, the Asian population in suburban areas of the nation’s 52 biggest metro areas grew 66.2 percent while those in the core cities expanded by 34.9 percent.

In a report issued last year, Connecticut’s Asian Pacific American Affairs Commission reported concerns related to education (especially English proficiency), healthcare, mental health services, job opportunities and legal services.  Concerns have also been raised regarding the increasing costs of higher education in Connecticut.

For example, the Commission noted “the lack of culturally competent health care professionals, including hospital interpreters, is an overwhelming, ethnicity-specific obstacle to health care access resulting in low rates of health services utilization, high rates of emergency room use, and inadequacy of prenatal care.”  The Commission also noted that “up to 53.3 percent of APAs lack English language proficiency due to the high proportion of immigrants (about 74 percent of APAs in Connecticut are foreign born).”  In addition, a report by the Commission indicated that “in the last six years, there has been a 350 percent increase in need for court interpreters.”

California has long been is the most frequent location for Asian immigrants to settle, with 4.8 million currently residing in the state, according to data published by newgeography.com.  New York, with 1.4 million Asians, ranks second while Texas, with 964,000, ranks third.

Asian populations are increasing quickly in the Sun Belt. Texas’ Asian population increased by 71.5 percent from 2000 through 2010, adding a net 402,277, second most in the country over that span behind California’s  1.1 million gain. Texas is home to the only city outside California and Hawaii in the top 20 of our list of the most heavily Asian U.S. cities: the Houston suburb of Sugar Land, where 37.1 percent of the 82,000 residents are Asian.

The newgeography website indicates that “One clear trend is that Asian populations are growing in areas that are on the cutting edge of the economy — in tech centers like Silicon Valley, and near New York’s global service firms (across the river from Manhattan, Jersey City is now 25 percent Asian.) Around the manufacturing and technology companies of the Detroit and Seattle areas, Asian communities are growing.

Meriden Superintendent Benigni Named One of 16 Leaders to Learn From in Education

Each year, the national publication Education Week shines a spotlight on some of the nation’s most outstanding school district leaders in its Leaders To Learn From special report. The 2015 group of 16  exceptional district-level leaders who are tackling some of the most pressing challenges in K-12 education includes Meriden Superintendent of Schools Mark Benigni, the only Connecticut education leader chosen. The 16 educators were selected because their work is highlighted by “ideas and strategies that are yielding strong results that can be borrowed, adapted, and put to successful use in other school systems,” according to the publication.

meridenIn Meriden, students at Casimir Pulaski, John Barry, and Roger Sherman elementary schools receive an additional 100 minutes of instruction each day with technical and financial support from a public-private partnership known as the TIME Collaborative.

Led by the National Center on Time & Learning and backed by the Ford Foundation, the initiative has brought expanded learning time to schools in 16 districts across five states – Connecticut, Colorado, Massachusetts, New York, and Tennessee.  In Connecticut, Meriden has been involved with the initiative since 2012.

“It’s not just getting more time for the sake of time.  It’s getting that time to do the enrichment activities that we know our students love and enjoy.  That’s what school should be about – exciting and inspiring kids,“ Benigni said.  “And the results have been tremendous.”  He cites “improved attendance, improved academics, improved feelings about the school climate and culture, but most importantly we have happy kids.”meriden sign

In selecting Benigni, Education Week noted that “as a city councilor, mayor, and now, a local schools chief, Mark D. Benigni has had one constant priority in his career: expanding educational opportunities for children in his hometown of Meriden.”

As superintendent of the 9,100-student Meriden school district, Benigni has orchestrated initiatives like full-day kindergarten, Saturday enrichment academies, and increased time for teacher collaboration, Education Week pointed out. Also highlighted were his efforts advocating for “state-of-the-art learning environments—breaking ground on a $230 million project to build two new high schools, and securing a $3.5 million grant from the Nellie Mae Education Foundation to design student-centered, blended instruction.”

“Most notably,” his selection as one of the 16 Leaders of 2015, was prompted by bringing the expanded learning time initiative  to three of the district’s elementary schools, “poLTLFsitioning Meriden—a majority-minority district—at the forefront of a national movement to increase student achievement and well-being through longer, more enriching school days.”

Benigni began his career as a special education teacher in Meriden, was an assistant principal in the neighboring Berlin district, and served his hometown of Meriden as a city councilor, and then mayor. He returned to the district as superintendent in 2010, after two years as a high school principal in the nearby Cromwell district.

Describing the selection project, Education Week notes that "in school districts across the country, education leaders are using innovative strategies to improve curriculum and instruction, address management challenges, stretch resources, engage parents and communities, utilize new technologies effectively, and create optimal learning environments that prepare all students for success beyond their K-12 years."

Benigni is the first Connecticut education leader selected since 2013, when Connecticut Technical High School System administrator Patricia Ciccone, who served as the superintendent of the 11,000-student technical high school system from 2003 until retiring in December 2012, was among that year's 16 Leaders to Learn From.

“I always knew education was my passion,” Benigni said. “Even as mayor, it was about what I could do to better the lives of people, and most importantly, students.”

https://youtu.be/4HW2QvE25W0

Millennials Present New Challenges to Insurance Industry Seeking Customers

Just as recently appointed Connecticut Insurance Commissioner Katharine L. Wade settles in to her job, the insurance industry is facing new challenges from a new generation. A former Cigna executive, Commissioner Wade has more than 20 years of industry experience and oversees a regulatory agency with jurisdiction over one of the largest insurance industries in the United States.  Hartford has long been considered the nation’s Insurance Capitol, so changes in the industry reverberate across the Constitution State.

It seems insurance companies have their work cut out for them when it comes to engaging their millennial customers. Of all the generations, millennials (born in 1980 to 1996) are the least likely to be fully engaged -- and the most likely to be actively disengaged -- with their primary insurer, according to a recent Gallup survey.

3siww10abkcj3m39d9khgaMillennials are the largest generation in the U.S. and will grow to dominate the market in the years to come, Gallup points out, adding that “insurance executives who neglect to take steps to engage this age group do so at their own peril.”

Insurance companies see substantial business gains when they engage customers of any generation, Gallup finds. Compared with their actively disengaged counterparts, engaged insurance customers are less sensitive about pricing when selecting and retaining a primary insurance carrier. They spend more and buy a wider variety of products, including financial offerings, from their insurer than do actively disengaged customers. They also stay with the company longer and are more likely to recommend it to others.insurance_1

But building and maintaining customer engagement can be challenging -- especially for insurance companies with a diverse customer base. To raise millennials' engagement -- and thereby ensure a more engaged customer base in the future -- Gallup indicates that "leaders must understand how these young customers differ from others in their engagement and consumer behavior."  And they do differ, in substantial ways.

In its 2014 Insurance Panel study, Gallup uncovered insights into what drives millennials to start a relationship or stay in one with an insurance company. The analysis revealed many similarities across generations, but it also uncovered two important approaches to build relationships with millennials, and key factors that differ with past generations.

  1. Family is key. Millennials are significantly more likely than other generations to have insurance coverage under a family member who chose the company. When their family members value an insurance company's brand, millennials follow suit. This finding contrasts sharply with older generations' prioritization of factors such as cost and company reputation.
  2. Millennials are more likely to buy insurance online. Millennials are more than twice as likely (27% vs. 11%, respectively) as all other generations to purchase their policies online rather than through an agent. Online purchasing is far from the mainstream among insurance consumers overall -- 74% originally purchased with an agent vs. 14% online -- but if this trend among millennials continues to grow, it could substantially change the way insurance companies interact with customers in the coming years.

The bad news?  Millennials are least satisfied of any generation with the online experience, which could contribute to their generally low engagement overall with their primary insurer. Improving interactions with customers online is, therefore, a smart investment toward building strong relationships within this future mainstream customer base, Gallup points out.

As insurance companies consider ways to improve those relationships with millennial customers, Gallup suggests seven key areas worthy of attention:  information security, family incentives, specialized services,  ease of making changes to coverage online, ease of finding answers online, easy access to a range of online services, and overall ease of use in areas including account management, payment and website navigation.

Millennials’ distinctive attitudes also extend to car insurance and long-term care insurance, according to other recent surveys.

Cars are increasingly being rejected by many millennials in favor of public transit or other modes of transportation, including increasingly popular ride-for-hire services.  As a consequence, car insurance is taking a backseat among some, the website NerdWallet reported this month. 42kr-vntpuuvwukbr__grqAccording to a study by the U.S. Public Interest Research Group, Americans are driving fewer total miles today than eight years ago, and driving fewer miles per person than we did in 1996.  It is a reversal after decades of steady growth.

Millennials are less likely to drive — or even have a driver’s license — than previous generations. From 1983 to 2008, the percentage of Americans age 20 to 24 with a driver’s license fell from about 90 percent of that age group to ju3147d6ba926618732903732fd442b68est over 80 percent, according to a University of Michigan study, the website noted.  If you don’t own a car, you don’t need car insurance.

In addition, Forbes recently reported that many of the nation’s millennials think their boomer parents are doing a lousy job planning for their long-term care needs, according to a survey from Genworth Financial, a leading seller of long-term care insurance policies.

The Aging Across Generations study, conducted with the J&K Solutions research firm, found that 27 percent of millennials would give their parents or loved ones a “failing grade” due to not planning for, or talking about, their long-term care needs.  And the kids say they’ll do better, with more than half (56 percent) of millennials surveyed expressing the view that they will plan for their long-term care needs more effectively than previous generations.

Time will tell.  Other impacts on the industry are likely to be more noticeable more quickly.

CT Ranked #3, Bridgeport-Norwalk-Stamford at #5, Among States, Regions with Most College Degrees

Connecticut has the nation’s third highest rate of residents holding a college degree – and the greater Bridgeport-Stamford-Norwalk area has the fifth highest rate among metropolitan regions, according to a new report by the Lumina Foundation. The report reveals" real progress has been made" in the national effort to increase post-secondary attainment, but "current rates won’t be enough to meet America’s future economic and workforce demands." The annual report, A Stronger Nation through Higher Education, finds that “unless actions are taken now to significantly increase post-secondary attainment, the nation will fall short of workforce needs by the end of this decade.

strongerConnecticut is making consistent progress on increasing attainment, according to the report. The most recent Census data (2013) show that 47.8 percent of the state’s 1.9 million working-age adults (those between the ages of 25 and 64) hold a two- or four-year college degree. This is an increase from last year’s rate of 47.5 percent and an increase from 46.6 percent in 2008. The state’s rate of higher education attainment is above the national rate of 40 percent.

A leading indicator of where higher education attainment rates are heading is the rate among young adults, those between the ages of 25 and 34. In 2013, this rate in Connecticut was 48.4 percent, higher than that of the adult population as a whole and also above the national rate of 41.6 percent.

According to the Georgetown Center on Education and the Workforce, 65 percent of U.S. jobs will require some form of postsecondary education by 2020. Yet, according the Lumina report, only 40 percent of working-age Americans (ages 25-64) held a two- or four-year college degree in 2013—the most recent year for which data are available. That figure is up from 2012, when the rate was 39.4 percent, and from 2008, when the rate was 37.9 percent, or a total of more than 2.8 million more degrees.

In Connecticut, 22.5 percent of residents ages 25-64 hold a bachelor’s degree, 17.1 percent have a graduate or professional degree, and 8 percent have an associate’s degree.  Eighteen percent have some college, but no degree, according to the data, provided by the U.S. Census Bureau’s 2013 American Community Survey.levels

Degree attainment in Connecticut, by ethnicity, was at 53 percent of Whites, 28.4 percent of African-Americans, 22 percent of Hispanics, 71 percent of Asians and 29 percent of Native Americans, according to the 2013 data. The progress nationally reflects incremental gains that the report authors say aren’t nearly enough to reach Goal 2025—a national effort calling for 60 percent of Americans to have a high-quality post-secondary degree, certificate or other credential by the year 2025.

The percentage of Connecticut residents (ages 25 – 64) with a college degree, by county, are:  Fairfield (53.8%), Middlesex (51.2%), Tolland (50.6%), Hartford (45.9%), Litchfield (44.6%), New Haven (43.4%), New London (41.1%), and Windham 32.1%).

In college enrollment, Connecticut exceeded the national average among residents age 18-24, but was slightly below the national average among residents ages 25-53.  Connecticut was below the national average among Hispanics 4.9% vs. 5.2%); slightly above among African-Americans, Native Americans, Asian Americans, and Whites.

“Economists and other experts give us good reason to be convinced that reaching Goal 2025 is a national imperative,” said Jamie P. Merisotis, president and CEO of Lumina Foundation, and a former Connecticut resident. “We have just 10 years to reach it, and our current pace of progress is insufficient for meeting employers’ workforce needs and addressing the growing inequality issues we face as a nation.”  Merisotis, testifying at the Connecticut General Assembly back in 2009, told legislators that "you will need to invest more in educating underprepared students than you do now. But invest you must. The alternative is a Connecticut far less prosperous and far less prepared to deal with the rapidly changing world in which we live."

A Stronger Nation estimates that if current trends continue, 30.7 million more Americans will earn college credentials by 2025. That increase will allow the nation to reach an attainment rate of 48.7 percent over the next 10 years—well short of the 60 percent needed to reach Goal 2025. To reach the Goal, Lumina estimates that another 19.8 million postsecondary credentials will need to be added.

Top 10 states—based on the percentage of adults (25-64) with at least an associate degree in 2013:

  1. Massachusetts —51.5% (up from 50.5%)
  2. Minnesota —48.1% (up from 47.7%)
  3. Connecticut —47.8% (up from 47.5%)
  4. Colorado —47.6% (up from 47.5%)
  5. New Jersey —46.5% (up from 45.8%)
  6. New Hampshire —46.4% (down from 46.7%)
  7. Virginia —46.1% (up from 45.3%)
  8. New York —46% (up from 45.1%)
  9. Maryland —46% (up from 45.5%)
  10. North Dakota —45.8% (up from 45.6%)

Among the nation’s metropolitan areas, the leading regions were:

  1. Washington, D.C./Arlington-Alexandria, Va.—55.36%
  2. San Jose-Sunnyvale-Santa Clara, Calif.—55.32%
  3. Boston-Cambridge-Newton, Mass.—54.73%
  4. Madison, Wis.—54.67%
  5. Bridgeport-Stamford-Norwalk, Conn.—54.41%
  6. San Francisco-Oakland-Hayward, Calif.—53.79%
  7. Raleigh, N.C.—53.57%
  8. Minneapolis-St. Paul-Bloomington, Minn.—51.80%
  9. Albany-Schenectady-Troy, N.Y.—49.82%
  10. Seattle-Tacoma-Bellevue, Wash.—49%


Primary School Teacher is Connecticut’s Most Common Job; Secretary Was For Most of Past Three Decades

What was the most common occupation in Connecticut in 2014?  Primary School Teacher. That’s according to data analyzed by National Public Radio, using U.S. Census data.  NPR checked the most common occupation in each of the 50 states, every two years from 1978 and 2014.

One of the key findings?  Farmers have virtually dropped off the map.  In only two states – North Dakota and South Dakota – were “farm managers” the leading occupation in 2014.  That compares with 8 states in 1978.

Primary school teachers were the most prevalent job in 2 states – New Hampshire and Alaska – in 1996. In addition to Connecticut, the other states in which Primary School Teacher was the leading job in 2014 were Alaska, Florida, Massachusetts, Rhode Island and West Virginia.

In 2014, the most common job in 4 states was “computer software developers” – Colorado, Utah , Virginia and Washington State.  The leading occupation in Washington, D.C.? Lawyers.

NPR points out that “through much of the '80s, as the U.S. economy shifted away from factories that make goods and toward offices that provide services, secretary became the most common job in more and more states. But a second shift — the rise of the personal computer — reversed this trend, as machines did more and more secretarial work.”

Connecticut’s most common occupation through the years:

  • Secretary             1978, 1982-1994, 2004, 2008, 2010job application form
  • Foreman              1980
  • Bookkeepers     1998
  • Truck drivers      1996, 2000
  • Nursing Aide      2002
  • School Teacher 2006
  • Primary School Teacher 2012, 2014

The NPR report points out that “driving a truck has been immune to two of the biggest trends affecting U.S. jobs: globalization and automation.”  The prominence of truck drivers is partly due to the way the government categorizes jobs, the report points out. It lumps together all truck drivers and delivery people, creating a very large category.

Other jobs are split more finely; for example, primary school teachers and secondary school teachers are in separate categories, as evidenced by Connecticut’s most common jobs – school teachers in 2006, primary school teachers in 2012 and 2014.common job map

Three CT Metro Regions Reach Top 50 in USA for Well-Being of Residents

The well-being of residents in three of Connecticut’s metropolitan areas are among the nation’s top 50, ranking at #36, #37 and #48 in a national survey of community well-being that evaluated the top 100 metro regions in the country. The 2014 Community Well-Being Rankings are the latest annual surveys by the polling company Gallup and the consulting firm Healthways. Reaching the top 50 from Connecticut were the Bridgeport-Stamford-Norwalk region (#36), West Hartford-Hartford-East Hartford (#37), and New Haven-Milford (#48), based on U.S. Census tract data. wbi_logo

The Gallup-Healthways Well-Being Index, surveyed residents to get a sense of their social, physical and financial health, as well as their sense of purpose and connections to their community -- all factors that contribute greatly to worker productivity, societal health costs and the economic competitiveness of a place, according to the polling firms as reported by Governing Magazine.

The 2014 rankings are based on 55-question surveys of about 176,000 people across all 50 states. The score for each community included metrics affecting overall well-being and five elements of well-being:

  • Purpose: liking what you do each day and being motivated to achieve your goals
  • Social: having supportive relationships and love in your life
  • Financial: managing your economic life to reduce stress and increase security
  • Community: liking where you live, feeling safe and having pride in your community
  • Physical: having good health and enough energy to get things done daily

mapThe Bridgeport-Stamford-Norwalk region ranked #5 in physical health, #43 in financial health, #58 in community ties, #63 in sense of purpose and #88 in social health.

The Hartford - West Hartford – East Hartford region ranked #18 in financial health, #20 in physical health, #30 in social health, #61 in sense of purpose and #62 in community ties.

The New Haven-Milford region ranked #6 in physical health, #47 in sense of purpose, #48 in social ties, #50 in financial ties, and #91 in community ties.

The South, Southwest and West Coast dominated the top 30, with Boston the only Northeast city, reaching that high.  California, North Carolina, Texas all have two communities in the top 10.report cover

Leading the list was Florida’s North Port-Sarasota-Bradenton area, which performed especially well in financial and physical health. Honolulu, Raleigh, California’s Oxnard-Thousand Oaks-Ventura area and El Paso, Texas, rounded out the top five.

El Paso was the only community to take the top ranking in two categories: sense of purpose and physical health.  That was also the only category to see a Connecticut metropolitan area reach the top 10. Elsewhere in New England, Providence-Warwick ranked #70.

The survey found that residents of high well-being communities exercise more frequently -- an important aspect of physical well-being -- but they are also more likely to report that someone close to them encourages them to be healthy, a critical component of social well-being. They are much less likely to be obese, they have fewer significant chronic health conditions, and they feel safe where they live. Those who feel safe where they live are, in turn, more likely to have access to a safe place to exercise and access to fresh produce, which are important community characteristics that are linked to lower levels of obesity.

Each community, defined as a metropolitan statistical area under the U.S. Census Bureau, received a rank in each category according to the strength of the responses from their residents and an overall rank as well.

Residents of the top well-being locations in the U.S. are “more likely to be thriving across each of the five critical elements of well-being, thus capitalizing on the synergistic benefits of each element acting in concert with one another,” the survey analysis indicated. “This may reflect what is perhaps the most important factor separating the nation's high well-being communities from those with lower well-being: a holistic view of well-being.”

Suicides in Connecticut, Nationally Increase in Recent Years, Extending Trend

The number of Americans who die by suicide has climbed to more than 40,000 deaths annually, according to data from the Centers for Disease Control and Prevention.  Between 2007 and 2012, total annual suicide deaths increased in all but two states, and twenty states recorded increases of more than 20 percent – including Connecticut, where the suicide rate increased 36 percent in the five-year period. suicide CT
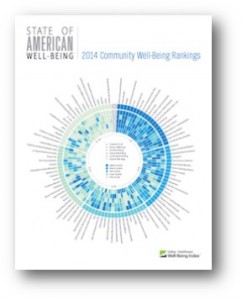
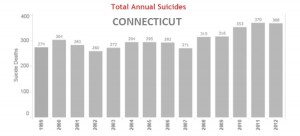
Connecticut had 368 suicides in 2012, compared with 271 in 2007, which was the lowest number in the state since 2002.  Suicide is the 10th leading cause of death in the United States, according to the CDC.  The data, through 2012, indicated that the rate of suicides in Connecticut ranked the state 44th in the nation, according to the National Center for Health Statistic as published in Governing Magazine.

In Connecticut, the age-adjusted rate of 9.9 per 100,000 population is below the national rate of 12.5, and well below states including Utah (21.0), New Mexico (21.3) and Montana (22.6).  New York (8.3) and New Jersey (7.4) had the lowest suicide rates among their population.  The number of suicides has increased in New York and decreased in New Jersey in recent years.

Nationwide, the number of suicides has been steadily increasing each year for more than a decade.  In 2012 there were 40,600 deaths by suicide reported, compared with 34,598 in 2007, an increase of 17 percent, and 29,350 in 2000.

Research hasn’t linked a single prevailing factor to steadily rising rates, according to published reports. But some of the more commonly cited culprits, according to Governing magazine, are the downturn in the economy, prescription drug abuse and returning veterans suffering from post-traumatic stress disorder.  About half of suicides nationally are committed with firearms, according to CDC data.

Suicide increases are especially apparent in what some have described as the Suicide Belt, a region stretching from Idaho down to Arizona and New Mexico where self-inflicted deaths are more prevalent, according to Governing. Some site the relative lack of access to mental health care as a possible contributing factor.USA suicide

From the 2012 CDC data, men were about four times more likely than women to take their own lives. Women, however, are about three times more likely than men to attempt suicide. From 1986 to 2000, suicide rates in the U.S. dropped from 12.5 to 10.4 suicide deaths per 100,000 people in the population. Over the next decade, however, the rate generally increased, and was at 12.5 percent by 2012.

https://youtu.be/R26mpTIVbx0

As Income Inequality Grows Nationwide, CT's Top 1% Earn More Than in Any State

Connecticut's top 1 percent earned an average of $2.7 million, compared to an average of $52,000 for the rest of the taxpayers -- a ratio of about 51 to 1, according to a report from the Economic Analysis and Research Network (EARN). The data indicate that the top 1 percent of taxpayers in Connecticut earn more than $677,608 — the highest 1-percent income threshold in the nation, according to the report issued earlier this year, based on 2012 data.  In addition, Connecticut has the largest income gap between the top 1 percent of taxpayers and the bottom 99 percent, according to a recent study, and a AP-GfK poll found that 68 percent of Americans believe that wealthy households pay too little in federal taxes. It is little wonder that some describe the nation – as well as Connecticut – as separate and disparate lands.  Income inequality drives the conversation.

CT stat
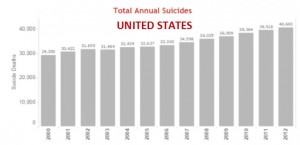
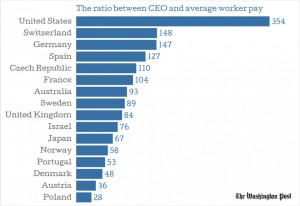
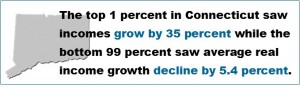
The top 1 percent in Connecticut saw incomes grow by 35 percent between 2009 and 2012, while the bottom 99 percent of Connecticut taxpayers saw average real income growth decline by 5.4 percent during the same period, according to the report. In fact, the states in which all income growth between 2009 and 2012 accrued to the top 1 percent include not only Connecticut, but Delaware, Florida, Missouri, South Carolina, North Carolina, Washington, Louisiana, California, Virginia, Pennsylvania, Idaho, Massachusetts, Colorado, New York, Rhode Island, and Nevada.pulldata

A recent article in the Boston Globe, Divided Nation, included the following:

  • The nation’s 100 richest families have as much wealth as the 80 million families who make up the bottom 50 percent in wealth, according to the University of California, Berkeley.
  • By the late 1970’s the wealth gap in America had substantially closed over the previous five decades, with the top .01 percent of Americans holding 7 percent of the nation’s wealth. The trend then reversed. By 2012, the top 0.1 percent controlled 22 percent of the nation’s wealth.  Projections are the percentage will reach 25 percent by next year.
  • An estimated 7 million families have lost their homes to foreclosure since 2007, according to Moody’s Analytics. And 6.5 million families still hold mortgages larger than the value of their home.pay chart

A study conducted at Harvard Business School last fall found that Americans believe CEOs make roughly 30 times what the average worker makes in the U.S., when in actuality they are making more than 350 times the average worker.  A previous analysis estimated that it takes the typical worker at both McDonald's and Starbucks more than six months to earn what each company's CEO makes in a single hour.

The average Fortune 500 CEO in the United States makes more than $12 million per year, which is nearly five million dollars more than the amount for top CEOs in Switzerland, where the second highest paid CEOs live, more than twice that for those in Germany, where the third highest paid CEOs live, and more than twenty one times that for those in Poland, the Harvard report indicated.

EARN reportThe wealth disparity is also on full display in politics, the Globe points out, noting that 100 super-wealth Americans accounted for 41 percent of contributions in 2012 to so-called Super Political Action Committees (PACs).

Widely reported estimates suggest that compensation of CEOs was about 20 times as much as the typical worker in the 1950s, rising to 42-to-1 in 1980 and 120-to-1 in 2000. In 2013, the ratio stood at 204-to-1 for the S&P 500, with the average of the top 100 companies at nearly 500-to-1, according to a 2013 Bloomberg Businessweek report cited a study by researchers at Rice University and the University of Houston last month, which found that for the vast majority of United States commercial banks, the ratio of CEO-to-employee pay was lower than at the top echelons of the S&P 500.

The EARN report concludes by starkly pointing out that “Policy choices and cultural forces have combined to put downward pressure on the wages and incomes of most Americans even as their productivity has risen. CEOs and financial-sector executives at the commanding heights of the private economy have raked in a rising share of the nation’s expanding economic pie, setting new norms for top incomes often emulated today by college presidents (as well as college football and basketball coaches), surgeons, lawyers, entertainers, and professional athletes.”