Combatting Childhood Obesity Starts From Day One; Wide-Ranging Policies Proposed

Less “screen time,” more physical activity, more nutritional foods and fewer sugary beverages – that’s the formula to prevent obesity from taking root in infants and toddlers in the formative years of childhood, according to new recommendations by the Child Health Development Institute (CHDI) of Connecticut.  A series of “science-based policy opportunities” for Connecticut, outlined this week, also include support for breastfeeding in hospitals and child care centers.scale The need for stronger action is underscored by recent statistics.  In Connecticut, one of every three kindergartners is overweight or obese, as is one of every three low-income children. Children who are overweight or obese are more likely, according to the policy brief, to have:

  • risk factors for future heart disease, such as high cholesterol and high blood pressure
  • a warning sign for type 2 diabetes called “abnormal glucose tolerance,” although many children are being diagnosed with the full-blown disease in increasing numbers
  • breathing problems such as asthma
  • gallstones, fatty liver disease, and gastroesophageal reflux (acid reflux and heartburn)
  • problems with their joints

“Recent research shows that obesity may be very difficult to reverse if children are not at a healthy weight by 5 years of age,” the policy brief indicated. “Investing early in preventing childhood obesity yields benefits for all of us down the line by fostering healthier children, a healthier population overall and greatly reducing obesity-related health care costs over time.”

The policy brief recommends five ways Connecticut’s child care settings and hospitals can help our youngest children grow up at a healthy weight:

  1. Support breastfeeding in hospitals and in child care centers and group child care homes.
  2. Serve only healthy beverages in all child care settings.
  3. Help child care centers and group child care homes follow good nutrition guidelines.
  4. Increase physical activity time for infants and toddlers in all child care settings.
  5. Protect infants and toddlers in all child care settings from “screen time.”

The recommendations stress that “talking, playing, singing and interacting with people promotes brain development and encourages physical activity,” and urges that healthy infant and toddler development be encouraged by:

  • Never placing them in front of televisions, computers, or tablets to occupy them
  • Never allowing infants and toddlers to passively watch a television, computer, mobile phone or other screen that older children in the same room are watching

“Healthy lifelong weight begins at birth,” said Judith Meyers, President and CEO of CHDI and its parent organization the Children’s Fund of Connecticut. “Investing in obesity prevention policies makes sense for Connecticut.”  Meyers added that “the numbers are staggering,” and it has become clear that “to really address this problem we need to prevent it in the first place.”

If Connecticut were to implement the five recommendations highlighted in the policy brief, it would be the first state in the nation to do so, officials said. 1-5 A number of the proposals have been successfully implemented in other jurisdictions, including states and cities.  Marlene Schwartz, Director of UConn's Rudd Center for Food Policy and Obesity, noted that Connecticut has long been a leader in providing nutritional lunches in schools, and said that now the state’s attention needs to move to the earlier years of childhood.  “The field has realized that we need to start even earlier,” she said.  Rudd also indicated that determining "policy changes that might help reduce the disparities" in Connecticut, which are apparent in race, ethnicity and socioeconomic data, is also essential.

Legislation now pending at the State Capitol, which is not as comprehensive as the policy brief recommendations, is designed to "increase the physical health of children by prohibiting or limiting the serving of sweetened beverages in child care settings, prohibiting children's access to certain electronic devices in child care settings, and increasing children's participation in daily exercise."  The proposed legislation, HB 5303, was recently approved by a 10-3 vote in the Committee on Children, but has an uncertain future before the full legislature.

Dealing with childhood obesity has been a challenge because of the “many different systems and programs that impact childhood development – which can also provide “many different places for opportunities to influence what happens.”  Officials said that some of the policy proposals can be realized through legislative action, others by regulatory changes, and others through voluntary initiatives.  They indicated that since Connecticut established the Office of Early Childhood in recent years, coordination of oversight and services has improved, which is an encouraging development.  Child care settings provide an opportunity to impact a large proportion of the state’s pre-kindergarten children, but plans to disseminate the message more broadly, including through pediatrician’s offices, are being considered. obesity consequences

The recommendations call for “allowing toddlers 60-90 minutes during an 8-hour day for moderate to vigorous physical activity, including running, and “adherence to federal nutrition guidelines” including more whole grains and low-sugar cereals, no sugary drinks, and fewer fried foods and high-sodium foods.  Through 11 months, infants should be served “no beverages other than breast milk or infant formula, and those 12 months through 2 years old should be served no beverages other than breast milk, unflavored full-fat milk water, and no more than 4 ounces of 100% fruit juice.”

The CHDI policy brief indicates that “childhood obesity can contribute to poor social and emotional health because overweight and obese children are often bullied and rejected by their peers as a result of their weight. That stress can affect every part of their development, interfering with their learning (cognitive), health (physical and mental), and social well-being.”

k obeseThe recommendations, described as “affordable, achievable, common sense measures,” were prepared for CHDI as part of a grant to the UConn Rudd Center for Food Policy and Obesity, funded by the Children’s Fund of Connecticut.  The author was public health policy consultant Roberta R. Friedman, ScM.

CHDI began focusing on strategies to promote healthy weight in children from birth to age two after publishing thechdi_logo IMPACT “Preventing Childhood Obesity: Maternal-Child Life Course Approach” in 2014. The report reviewed scientific research on the causes of obesity and explored implications for prevention and early intervention. In 2015, the Children’s Fund of Connecticut funded four obesity prevention projects in Connecticut that addressed health messaging, data development, policy development and baby-friendly hospitals.

Unemployment Drops in Waterbury, Norwich/New London Lead CT; Unemployment Lowest in Danbury

The unemployment rate in greater Waterbury and the Norwich-New London saw a larger decrease during the past year than Connecticut’s other large metropolitan areas, and the state’s lowest unemployment rate can be found in Danbury, according to new data released by the U.S. Bureau of Labor Statistics. Danbury was the only one of the state’s six largest metro region to crack the top 200 for lowest unemployment rate, earning a spot at number 168. The year-over-year unemployment data shows that unemployment rates were lower in January 2016 than a year earlier in 333 of 387 metropolitan areas in the U.S., higher in 43 areas, and unchanged in 11 areas. In Connecticut, the six major metropolitan areas all saw a decline in the unemployment rate.chart

Nationwide, the unemployment rate dropped eight-tenths of a point, from 6.1 percent in January 2015 to 5.3 percent in January 2016.  Only one Connecticut region – Danbury – had a lower unemployment rate, at 5.1 percent.  Generally in Connecticcut, the larger the unemployment rate in January 2015, the larger the drop over the following year.

The one percent drop in unemployment in Waterbury and Norwich-New London-Westerly ranked each region tied for 124th for the largest drop in the nation.  Also reaching the top 200 for the largest reduction in unemployment was the Hartford-West Hartford-East Hartford area, ranking 197th with a drop of 0.7 percent, from 6.7 percent to 6.0 percent.

Even with the drop in unemployment, Waterbury’s jobless rate is the highest among the state’s major urban areas, at 7.4 percent. Bureau-of-Labor-Statistics

In this year’s rankings, Waterbury was number 342 with an unemployment rate of 7.4 percent. Norwich-New London-Westerly was at number 295 with an unemployment rate of 6.4 percent.  New Haven and Hartford-West Hartford-West Hartford were tied at number 263 with an unemployment rate of 6.0 percent, and Bridgeport-Stamford-Norwalk at number 235 with an unemployment rate of 5.8 percent, down from 6.3 percent a year ago.

Ames, Iowa, and Boulder, Colo., had the lowest unemployment rates in January, 2.5 percent each. El Centro, Calif., had the highest unemployment rate, 19.2 percent. A total of 187 areas had January jobless rates below the U.S. rate of 5.3 percent, 184 areas had rates above it, and 16 areas had rates equal to that of the nation.

PERSPECTIVE: The Economic Impact of Not Investing in Social Purpose Sector Leadership

by Maggie Gunther Osborn As a leader in transition leaving Connecticut, I wanted to reflect on what is happening with leadership in the social purpose sector in our state and sound a few alarm bells. For those of you unfamiliar with my terminology, I am talking about what we normally refer to as the non-profit sector.  I have chosen to stop saying non-profit, because it has trained us to believe that this is a sector with limited economic impact or does not require the same investments in infrastructure and human capital as other sectors. Non-profit is a tax status but does not describe the work of the social purpose sector.

CT perspectiveIn Connecticut, the social purpose sector employs between 14-17% of the workforce and generates $33.4 billion in revenues annually. Connecticut foundation giving supporting the sector totals more than $1 billion, but is primarily invested in the programs and outcomes of the sector giving very little attention to investment in leadership.  In fact, nationally less than 1% of all foundation grants support leadership capacity and development. The social purpose sector is a vital, critical part of our state and yet is not often regarded as such in discussions of economic benefit, sustainability, leadership, innovation and job creation.quote 1

I sit around the periphery of these discussions and see that much of the energy is focused on the leadership of organizations. We invest in leadership training for our corporate workforces because we understand it is key to the culture, sustainability and productivity of business. I often ask board members who run successful enterprises what they attribute their success to and often they reply “we invest in our people.” And yet very few of them, in their roles as board members, bring that same thought perspective to bear on social purpose decisions.

The result of a lack of investment in the leadership of the social purpose sector is leading to the statistics revealed in Third Sector New England’s Leadership New England Report 2015: Essential Shifts for a Thriving Nonprofit Sector.

  • 60% of CT leaders say they will be leaving their organizations within the next five years and 47% of those in the next two years.
  • 59% of CT leaders are over 55 compared to 53% in the New England region as a whole.
  • More than 54% of organizations have no succession or sustainability plan.
  • 61% of CT leader’s salaries are under $100k with 21% under $50k.
  • 59% of CT organizations have 3 or fewer month’s cash reserves in comparison to 49% of all New England organizations.
  • 29% of CT organizations have no cash reserves compared to just 7.2% of all New England organizations. This indicates that a much larger proportion of CT organizations is at risk of immediately running out of funds than the respective proportion in New England as a whole.

quote 2At this point, there are a couple of things to note. First, while we have been talking about leadership transitions for many years, the recession delayed the major transition of leaders out of the sector until now.  Second, there is no bench strength to call on from within these organizations when these leaders retire.  Very little investment has been made to build the skills and capacity of middle managers to step up into leadership roles. Third, most of the departing leaders are Baby Boomers whose leadership roles were dependent on their willingness to work long hours in a professionalized volunteer sector.  We will not fill these rolls with Millennials and Gen Xers for what we paid their predecessors.
Current professionals expect to work in places that are dynamic and culturally competent business environments where they feel comfortable and can advance.  They will not stay a professional lifetime anywhere, and will not stay more than a few years where these characteristics do not exist. In addition, the state budget crisis is going to be our norm for the next decade consequently offloading more responsibility to this sector. We need people with the skills to not only provide services, but also create new business models, attract talent and strategically work through these enormous challenges.

All of us, whether professional, volunteer, elected official, philanthropist, board member or donor, should strive to recruit the best and brightest to the social purpose sector by investing in leadership in the same ways we do in the private sectors. Strong leaders will make the next generation of the social purpose sector resilient enough to meet the challenges that face Connecticut.

______________________________________

Maggie Gunther Osborn is president of the Connecticut Council for Philanthropy.  She will be leaving the organization in June to assume the post of chief strategy officer for the Forum of Regional Associations of Grantmakers in Washington, DC. 


PERSPECTIVE commentaries by contributing writers appear each Sunday on Connecticut by the Numbers.

LAST WEEK: Reaching Untapped Potential of Urban Students

Raising Revenue Getting Tougher for Towns, Cities in Connecticut; Property Tax Drives Disparities

The Connecticut Data Collaborative has launched a series of reports that will examine the fiscal situation of Connecticut’s 169 municipalities making the data compiled in several recent statewide initiatives that examined fiscal challenges facing the state and its towns more readily accessible to the public. The goal is to “highlight the major findings from these initiatives and reports; expand on the research that was done; present it through a new medium; and inform a broader audience on the work being done in the state.”

The first data story, published this month, highlights the findings from a report to the General Assembly’s Program Review and Investigations Committee prepared by the Federal Reserve Bank of Boston’s New England Public Policy Center (NEPPC), “Measuring Municipal Fiscal Disparities in Connecticut.”map

The conclusion: the capacity to raise revenue from property taxes is the main driver of fiscal disparities in Connecticut.

  • 78 of 169 towns have a deficit, with revenue capacity below the cost of providing services. These 78 towns represent almost 60 percent of state’s population.
  • 91 of 169 towns have sufficient capacity to raise revenue capacity to cover the cost of services.
  • Municipal cost differences exist but are not as dramatic as the differences in the ability to raise revenue
  • Current state non-school grants made to towns have a limited effect in reducing non-school fiscal disparities in Connecticut.
  • Five cost factors were identified as driving non-school municipal costs: unemployment, population density, private sector wages, town road maintenance, and jobs per capita.
  • Statistical analysis shows that the following factors do not impact costs: poverty, population, the share of foreign-born population, and the share of older rental housing units

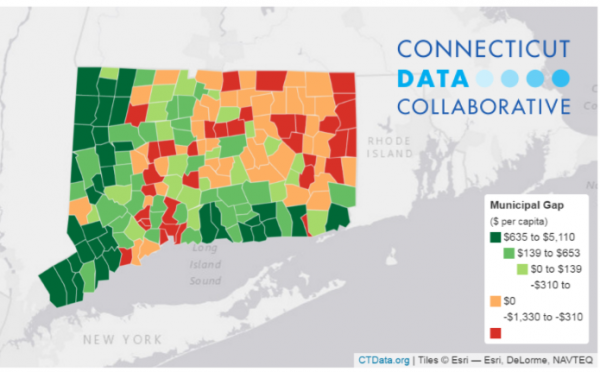
The website points out that “a municipal gap exists when the costs are higher than the revenue raising capacity,” and provides an interactive town-by-town listing of the “gaps.”  The highlighted findings:

  • The largest gaps are in Hartford (-$1,330), Bridgeport (-$1,168), New Haven (-$1,101), New Britain (-$1,056) and New London (-$896). The largest surpluses are in Westport, New Canaan, Darien, and Greenwich.  The data is FY 2007-2011, averaged.
  • 78 towns in the state have a deficit - the capacity is below the cost of providing services. These towns cover almost 60 percent of state’s population.
  • 91 towns have sufficient capacity to raise revenue greater than the cost of services. These towns cover 40 percent of the state’s population, primarily in Fairfield County, Litchfield and the shoreline.

Since property taxes are the primary way that municipalities raise revenue, the website examined the trends in the Equalized Net Grand List (ENGL) since 2011.  Overall, property tax revenue has been on the decline, the data indicated. An interactive table on the site shows - by town- the average annual growth rate (or decline) in the grand list from 2011 to 2014, and also shows the Municipal Gap calculated by the report. In total, ENGL has declined for 145 of the 169 towns since 2011 – “thus the revenue raising capacity for towns has only become more difficult.”

Most Expensive State for Car Insurance? Michigan Ranks First, CT is 17th

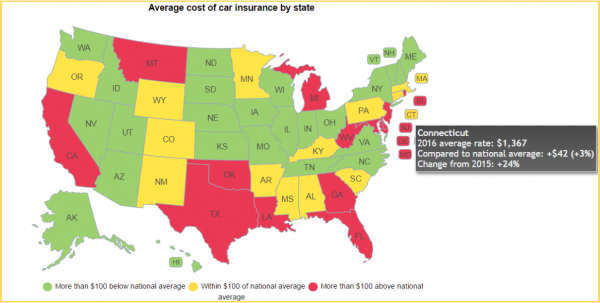
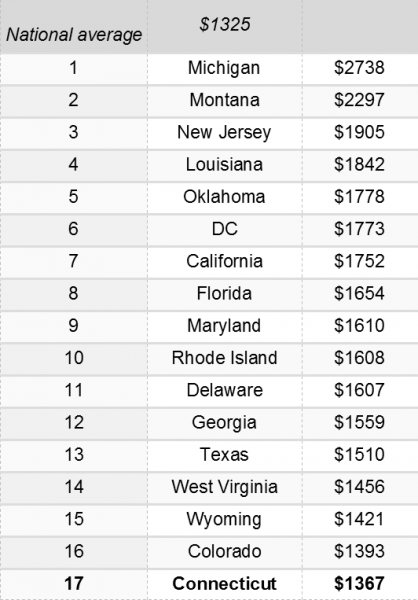
The most expensive car insurance rates in the nation are in Michigan.  Connecticut ranks 17th.   It is the third consecutive year that Michigan has topped the list. Connecticut’s average of $1,367 is 3 percent above the national average of $1,325.  The average rate in Connecticut jumped by 24 percent from 2015 to 2016, according to the survey.  The Connecticut data was compiled in February.  Among the New England states, Rhode Island was ranked tenth, averaging $1,608, Massachusetts ranked 21st at $1,325. Maine had the lowest rates, at $808 annually.

Insure.com’s 2016 state-by-state comparison of auto insurance premiums found that Montana captured the No. 2 spot for the second year in a row. New Jersey broke into the top five for the first time ever, Louisiana was No. 4, and Oklahoma rounded out the top five.list

On the flipside of the cost coin, Maine led the way for the cheapest car insurance in the country. Maine has been in the top three for the least expensive car insurance for all six years of the study, according to insure.com. This year, Ohio came in No. 2, Wisconsin was three, Idaho took fourth, and New Hampshire earned No. 5.

The annual study compiles rates from six large insurance carriers in 10 ZIP codes in every state. Rates were for the same full-coverage policy for the same driver -- a 40-year-old man with a clean driving record and good credit. The rates are an average for the 20 best-selling vehicles in the U.S. in order to present more accurate rates for the average driver – without high-end sports or luxury cars skewing the data. Each model was rated on its cheapest-to-insure trim level.

mapThe national average for a full-coverage policy as featured in the Insure.com report came in at $1,325 this year – a slight increase from last year’s average of $1,311. Rates varied from a low of $808 a year in Maine to a budget-busting $2,738 in Michigan. Insurance rates in Michigan are more than double (107 percent) the national average.
Insurance rates are influenced by a number of different factors. Everything from traffic, crime rates, state and local laws, the percentage of uninsured drivers, as well as the number of insurance companies competing in a market can all result in higher or lower insurance premiums in your state.

Insure.com commissioned Quadrant Information Services to calculate auto insurance rates from six large carriers (Allstate, Farmers, GEICO, Nationwide, Progressive and State Farm) in 10 ZIP codes per state. Insure.com averaged rates in each state for the cheapest-to-insure 2016 model-year versions of America’s 20 best-selling vehicles and ranked each state by that average. Rates are for comparative purposes only within the same model year.

CT Obesity Rate is 43rd in US; Steadily Increasing, But Among Lowest Rates

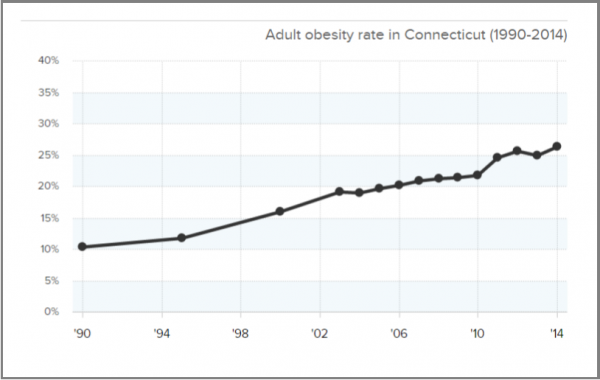
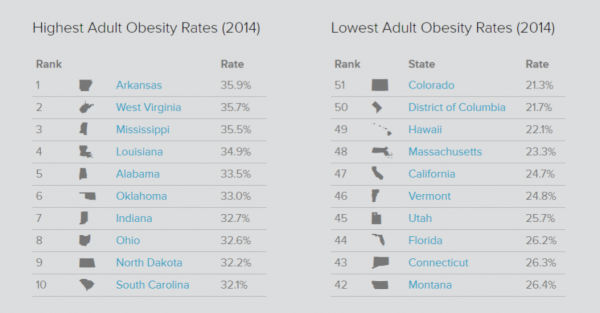
Connecticut’s obesity rate has increased dramatically during the past two decades, but the state has among the lowest adult obesity rates in the country, ranking 43rd among the states in an analysis of obesity rates. According to the most recent data, rates of obesity now exceed 35 percent in three states (Arkansas, West Virginia and Mississippi), 22 states have rates above 30 percent, 45 states are above 25 percent, and every state is above 20 percent. Arkansas has the highest adult obesity rate at 35.9 percent, while Colorado has the lowest at 21.3 percent.CT rates

Connecticut now has the ninth lowest adult obesity rate in the nation, according to The State of Obesity: Better Policies for a Healthier America. Connecticut's adult obesity rate is currently 26.3 percent, up from 16.0 percent in 2000 and from 10.4 percent in 1990.

U.S. adult obesity rates remained mostly steady — but high — in 2014, the most recent full year data available, increasing in Kansas, Minnesota, New Mexico, Ohio and Utah and remaining stable in the rest.

The analysis also found that 9.2 percent of adults in the state have diabetes, an obesity-related health issue, ranking 35th in the nation as of 2014. It is the highest rate in the state in the past 25 years. The number of diabetes case is projected to increase from 267,944 in 2010 to 412,641 by 2030, at the current pace of increase.obesity rates

The adult hypertension rate, 31.3 percent, ranks Connecticut 27th among the states.  The number of hypertension cases is projected to increase from 708,945 in 2010 to 941,046 by 2030.  Heart diseases is projected to increase from 214,986 people in 2010 to 1,014,057 in 2030, and obesity-related cancer is projected to more than double in 20 years, from 58,115 in 2010 to 147,883 in 2030.

The state-by-state analysis is a project of the Trust for America’s Health and the Robert Wood Johnson Foundation.

Charter Oak State College's First Online Graduate Degree Program Approved; to Begin This Fall

For the first time in it’s more than 40-year history, Charter Oak State College, Connecticut’s public online college, will be offering an online graduate degree program beginning this fall. A Master of Science in Organizational Effectiveness and Leadership, developed by the College, has been approved by the New England Association of Schools and Colleges (NEASC), the College’s regional accrediting authority. Charter-oak-state-college-logo

“Our alums want to pursue higher degrees, and many want to continue their studies at their alma mater, Charter Oak State College.  For working adults, our online format fits their lifestyle, and our workforce focused degree programs resonate with employers and employees alike,” said Ed Klonoski, President, Charter Oak State College.

The Master of Science in Organizational Effectiveness and Leadership is a 33 credit online degree program with student outcomes including expanding leadership skills, managing change, improving decision making skills, and conducting applied research, officials said.  The program includes the option to choose one of two tracks – business or non-profit.

Prospective students can request more information at www.CharterOak.edu/masters. Online applications to be available later this Spring.

Founded in 1973, Charter Oak State College is Connecticut’s only public online college, offering associate and bachelor’s degree completion programs in high-demand fields including Health Information Management, Health Care Administration, Cyber Security and Business Administration.  Charter Oak is accredited by the New England Association of Schools and Colleges and governed by Connecticut’s Board of Regents for Higher Education.


73 Local Health Departments Serve CT's 169 Municipalities

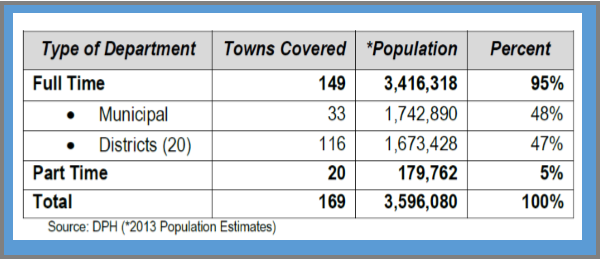
Connecticut has 73 local health departments serving the state’s entire population – individuals residing in the state’s 169 cities and towns. Data compiled by the state Office of Legislative Research breaks down the health departments by full-time and part time, as well as their geographic coverage. Of the 73 local health departments across the state, 53 are full-time departments, while the remaining 20 are part-time. The full-time departments include 33 individual municipal health departments and 20 health district departments (multi-town departments serving from two to 20 towns).numbers

By law in Connecticut, a town may have a part-time health department if: (1) it did not have a full-time department or was not part of a full-time district before January 1, 1998, (2) it has the equivalent of one full-time employee, and (3) the Department of Public Health commissioner annually approves its public health program and budget.

According to the Department of Public Health (DPH), based on the state’s 2013 estimated population, full-time health departments (both municipal and district) serve about 95 percent of the state’s population, while part-time departments serve the remaining 5% percent, OLR reports.

Connecticut’s local public health system is decentralized and a local health department falls under the jurisdiction of its respective municipality or district. Staff are hired and employed by the municipal or district health department.

The law requires towns, cities, and boroughs to nominate a municipal health director, who must be approved by their respective legislative bodies and DPH. The DPH commissioner may remove the director for cause. The town, city, or borough may also take such action with the commissioner’s approval.public health

Municipal and district health departments enforce the state’s public health laws, rules, and regulations, including the Public Health Code. Responsibilities include jurisdiction to:

  • examine and remediate public health hazards, nuisances, and sources of filth;
  • levy fines and penalties for Public Health Code violations;
  • grant and rescind license permits (e.g., for food service establishments or septic systems);
  • establish fees for health department services;
  • submit to DPH reports on reportable diseases from health care providers and clinical laboratories; and
  • provide for sanitation services (district directors may serve as sanitarians as practical).

Full-time municipal and district health departments receive state funding. The legislature eliminated funding for part-time health departments in 2009, according to OLR.