CT Has Nation’s Highest Average Rate of Student Debt, Topping $35,000 Per Borrower

In 2017, more than 44 million Americans are working to repay student debt.  Nowhere in the nation is the challenge and burden of student debt more acute than in Connecticut, which has the highest student-debt-per-borrower average in the United States. At $35,947, Connecticut’s average student loan debt outpaced the nation, where, on average, borrowers are working to repay more than $28,000 after graduation.  That’s according to student loan and refinancing marketplace website LendEDU.com’s recently released study and analysis.  LendEDU has pointed out that 59 percent of college graduates in the state have student loan debt. 

In addition to having the highest student-debt-per-borrower average, according to LendEDU’s analysis, Connecticut has the:

  • 12th highest percentage of graduates with debt (68%)
  • 29th highest default rate (5.66%)
  • 31st highest college enrollment (133,999)

Student loan debt is the second highest form of debt in the U.S., second only to mortgages, according to LendEDU.  In addition, nationwide:

  • Over 40% of borrowers have delayed starting a family because of their debt
  • Over 60% of borrowers have delayed buying a car because of their debt
  • Over 70% of borrowers have delayed saving for retirement because of their debt
  • Around 75% of borrowers have delayed buying a home because of their debt

In terms of average student debt, among the states with the highest levels, after Connecticut, are New Hampshire (#49), Pennsylvania (#48), Rhode Island (#47), Delaware (#46),  Massachusetts (#45), New Jersey (#44), Minnesota (#43), Iowa (#42), South Carolina (#41), and New York (#40).

At $42,912, the average student debt per borrower in Connecticut’s 4th Congressional District, is not only higher than the state average, but is the highest among Connecticut’s five congressional districts.

In the 1st Congressional District (Rep. John B. Larson) it’s $32,003; in the 2nd (Rep. Joe Courtney), $28,900 the 3rd (Rep. Rosa L. DeLauro), $38,255; and the 5th District (Rep. Elizabeth Esty), $20,246.

The portion of graduates with student debt in 4th District is 70% — tying with the 3rd District for second highest in the state. At 84 percent, the 5th Congressional District has the highest portion of graduates with debt in the state, while the 1st District has the lowest, at 52 percent.

While the student loan default rate in U.S. Rep. Jim Himes’s district (4.99%) is lower than the state average, it is the second highest in the state. The 5th District has the highest student loan default rate, at 11.84 percent, while the 3rd District has the lowest, at 3.73 percent.

The largest college going population is in the New Haven-centered 3rd Congressional district, with enrollment of 46,440 students, according to the website.  The 4th Congressional District has a total college enrollment of 21,537, just behind the 3rd District (46,440) and 5th District (22,451). The 2nd Congressional District has the smallest enrollment total in the state, at 11,605.

Among the state’s public colleges, the average student debt ranged from UConn’s $25,000 to Central Connecticut State University’s $27,920.  Among all the state’s colleges and universities, among those with the highest average debt levels are Quinnipiac University, Sacred Heart University, and University of New Haven, all in the top 10 nationally with average student debt exceeding $40,000.


PERSPECTIVE: Public + Private = Powerful

by Rie Poirier-Campbell It’s no secret that the Hartford Public Schools are facing severe budget challenges, tied largely to our city’s and state’s grave financial pains. In fact, the magnitude of the problem in the school district is unprecedented, with a gap of as much as $20 million predicted for next school year.

Recently, Aetna, Travelers and The Hartford stepped up to help our city in a big way: pledging a combined $10 million each year for five years to ease the budget crisis, and – equally important – calling on other corporations to join them. This is the kind of fresh, civic-minded, business-smart, public/private approach that can help our community begin to dig out and move forward.

Public/private partnerships aggregate and focus new resources to public needs in a way that a strict reliance on tax dollars never can. They also bring highly creative thinking, enthusiastic teammates and often more cost-effective systems for delivering needed services.

Public/private partnerships are more than just an extra source of revenue. They’re a new way of doing business. Like all partnerships, they may take more work and ramp-up time than going it on your own. And they take ongoing investment on both sides. But the payoffs are far greater.

That’s the idea behind Hartford Performs’ partnership with the Hartford Public Schools. A few years ago, when Hartford students’ test scores were at their lowest, our region’s vibrant arts community asked the school district how it could help. Many arts organizations and teaching artists had done some work in the schools and saw how adding music or theater techniques to a lesson could help children learn. They, along with classroom teachers, knew that when students get up and dance like planets in the solar system, they internalize abstract concepts such as rotation and revolution. When they act out a scene from a book, they better understand the characters’ motives and develop empathy.

What they also knew was that, while some students in Hartford had access to this kind of innovative teaching approach, most did not. What was needed was a system for making sure that every student, regardless of grade or school, have the benefit of arts experiences that would help them learn core subjects.

So the school district and the arts community created a public/private partnership to build that system. Hartford Public Schools invested financial resources; arts organizations invested human resources and innovation; and forward-thinking corporations and foundations created leverage by underwriting the infrastructure to make it all work.

The result is that, today, every Hartford Public School student from prekindergarten through eighth grade has teaching artists visit their classrooms several times a year to help them understand things like fractions, adverbs, the water cycle and the Emancipation Proclamation, by drawing, dancing, drumming and dramatizing. The students are not only learning, they’re enjoying what they’re learning. It’s such a powerful model. I will never forget seeing a student’s eureka moment when he finally figured out what one-eighth meant by coloring it out with a teaching artist.

The numbers bear out how well this approach works. Teachers who participated in a recent independent evaluation said that Hartford Performs programs helped their students develop vocabulary (92%), express themselves verbally (88%), develop active listening skills (96%), work collaboratively with other students (86%), develop problem-solving skills (75%), retain information (93%), develop social skills (89%) and express themselves in writing (65%).

None of this would have been possible without the public/private partnership that developed this broad-reaching and cost-effective system of services for Hartford kids. Further, it’s easy to see how this model can be replicated to serve Hartford students in other areas, such as sports, life skills, civics or vocational/technical learning.

Even – and I would argue especially – in tight budget times, this model is well worth continued investment by all partners, private and public, who are interested in advancing the achievement of Hartford students.

__________________________________

Rie Poirier-Campbell is Executive Director of Hartford Performs


Higher Ed Panel on Innovation and Entrepreneurship Seeks to Map Statewide Plan

The charge of the state's Higher Education Innovation and Entrepreneurship Initiative is to strengthen innovation and entrepreneurship within Connecticut’s public and private higher education institutions while fostering collaboration and providing economic value to Connecticut. The Higher Education Innovation & Entrepreneurship Working Group, in accordance with Public Act 16-3, met in December, and again in mid-February, and aims to complete its work in May to develop a plan to support innovation and entrepreneurship.  Joanne Berger-Sweeney, Trinity College president and professor of neuroscience, and Mark E. Ojakian, president of the Connecticut State Colleges and Universities system (CSCU), were selected in December to co-chair the working group that includes public and independent institutions of higher education from throughout the state.

The group, which is staffed by CTNext, will send its strategic roadmap to CTNext’s board of directors for approval. Once the plan is approved, the board will elect an advisory committee made up of public and private school officials and student representatives. This new committee will advise the CTNext board of directors as it deploys $2 million each year for the next five years to projects and initiatives that fit the priorities identified in the strategic road map, according to the CTNext website.

The working group is tasked with developing a master plan for fostering innovation and entrepreneurship at in-state public and independent colleges and universities. The master plan will:

  1. address opportunities and risks to innovation and entrepreneurship resulting from existing and emergent conditions affecting entrepreneurial programs and initiatives at institutions of higher education;
  2. assess the scope and scale of existing entrepreneurial programs and initiatives at such institutions in the context of best practices at state and national institutions of higher education that are leaders in innovation and entrepreneurship;
  3. recommend initiatives that facilitate collaboration and cooperation among institutions of higher education on projects that address and strengthen innovation and entrepreneurship at such institutions;
  4. provide for the establishment of a state-wide intercollegiate business plan competition; and
  5. identify funding priorities for higher education entrepreneurship grants-in-aid pursuant for projects that expand and enhance entrepreneurial programs and initiatives or projects involving partnerships among institutions of higher education.

“As co-chair, I look forward to working closely with colleagues from across Connecticut,” said Berger-Sweeney. “Our strategic planning to support entrepreneurship and innovation is critical to the economic vitality and future of the state.”

“I’m excited to work with all our presidents, both public and private, to find ways to nurture innovation and entrepreneurship at our institutions,” said CSCU President Ojakian. “Our mission is help our students turn their creative ideas into businesses that will grow and thrive in Connecticut.”

During the working group’s December meeting, which ran just over an hour, participants from 27 colleges and universities, including the presidents of most of the institutions, discussed the challenges and opportunities to advance innovation and entrepreneurship on their campuses and in the state.
According to the meeting minutes, there was discussion on how best to allocate $10 million ($2 million/year for 5 years), centered on determining a strategy to leverage the funds.  Participants suggested a focus on partnerships, and urged efforts to “think from the beginning about how to connect people (broadly) to the jobs that will be created,” along with a “commitment to creating a whole that is greater than the sum of the parts.”  Education leaders also noted that Connecticut “is relatively more highly regulated than other states in public education,” which could make the effort “more difficult.”

The college and university leaders also listed an array of assets that exist in Connecticut which could spur their efforts.  Among those cited were:

  • Strong medical/bio-science institutions
  • Long standing leader in advanced manufacturing
  • Lower cost of real estate relative to Cambridge and Silicon Valley
  • Leadership in aerospace
  • International linkages/partnerships
  • Prime location between NYC and Boston

Also mentioned was the fact that Connecticut has “a lot of empty buildings” in “legacy cities ripe for redevelopment.”  Connecticut’s status as a financial capital, and the potential collective political force of higher education leadership were also noted as potential pluses.

Late last year, CTNext issued an RFP for “qualified independent higher education institutions, policy institutes, or research organizations to conduct certain analyses of innovation and entrepreneurship in the state.”  The assignment proposed included: “a baseline assessment of the state’s innovation and entrepreneurship based on certain program measures,” including:

  1. the increase or decrease in the state’s (a) start-up businesses, including growth stage start-ups; (b) software developers; and (c) serial entrepreneurs (i.e. those having brought at least one start-up business to venture capital funding by an institutional investor);
  2.  job growth within growth-stage businesses;
  3. the amount of private venture capital invested in start-up and growth-stage businesses;
  4. employee turnover at start-up and growth-stage businesses;
  5. the amount of entrepreneurship and innovation research funded by higher education institutions in the state;
  6.  the rate at which businesses enter and leave the state; and
  7. the degree to which the state’s (a) hiring rate exceeds its job creation rate and (b) employment separation rate exceeds its job loss rate.

CTNext is Connecticut’s innovation ecosystem designed to build a more robust community of entrepreneurs and to accelerate early-stage growth by providing access to talent, space, industry expertise, services, skill development, and capital to foster innovation and create jobs in Connecticut.  CTNext is a wholly-owned subsidiary of Connecticut Innovations.


Photos:  Trinity College President  Joanne Berger-Sweeney, CSCU President Mark Ojakian; February meeting of working group.  

CT Residents Have Among the Highest State & Local Tax Burdens in US

Two separate analyses of tax burdens across the nation’s 50 states have placed Connecticut in the top ten – among those with the highest state and local tax burden.  The state-by-state reviews, by the financial websites 24/7 Wall Street and WalletHub, rank Connecticut second and sixth respectively. “With some of the wealthiest neighborhoods in the country, Connecticut residents pay more in property taxes than in nearly any other state,” says 24/7 Wall St. in its review. “Residents pay $2,774 per capita in property taxes, almost twice the national average. The state’s effective property tax rate of 1.7% of the value of a typical Connecticut home is the sixth highest of any state. Despite the high tax burden overall, the state’s pension system is relatively underfunded. Connecticut has just 51% of the funding for its pension obligations, the fourth smallest share nationwide.”

The Connecticut financial highlights include:

  • Taxes paid as pct. of income: 12.6%
  • Income per capita: $68,704 (the highest)
  • State income tax collections per capita: $2,279 (the highest)
  • Property tax collections per capita: $2,774 (3rd highest)
  • General sales tax collections per capita: $1,137 (8th highest)

In the 24/7 Wall Street report, the highest tax burden was attributed to New York.  Rounding out the top ten after Connecticut were New Jersey, Wisconsin, Illinois, California, Maryland, Minnesota, Rhode Island and Oregon.

The WalletHub rankings, using a somewhat different methodology, ranked Connecticut has having the 6th highest tax burden among the states.  Include were these snapshots of Connecticut (the higher the ranking the lower the rate):

  • 46th – Overall Effective State & Local Tax Rate
  • 33rd – Income Tax
  • 34th – Sales & Excise Taxes

The highest tax burdens were in Illinois, Nebraska, Wisconsin, New York, Rhode Island, Connecticut, Ohio, Michigan, Iowa and New Jersey.  In order to identify the states with the highest and lowest tax rates, WalletHub’s analysts compared the 50 states and the District of Columbia across four types of taxation, real estate tax, vehicle property tax, income tax and sales & excise tax.

Schools of Distinction in Connecticut; 116 Earn Designation

Over 100 schools statewide across Connecticut have been recognized by the Connecticut State Department of Education (CSDE) as 'Schools of Distinction' for the 2015-2016 school year. The state recognized 116 schools for high academic achievement and high growth, including 15 schools within the state's Alliance District program. The state's alliance district program is a targeted investment in Connecticut's 30 lowest-performing districts.

To qualify for the distinction designation, schools cannot have high achievement gaps or high graduation rate gaps, and must also meet participation rate requirements.  'Schools of Distinction' are schools that meet the following criteria, according to the CSDE.

  • the top ten percent of schools using the Accountability Index score;
  • the top ten percent of schools with the highest growth for all students or for the high-needs group (free or reduced price lunch, English language learners, and students in special education); or
  • the top ten percent of schools (among those without growth) with improvement in Accountability Index.

Danbury, Greenwich and Ridgefield have six schools each on the list, the most of any district in the state.

Shelton, Stratford and Trumbull had four schools among those designated, and Glastonbury and Regional School District 12 each had three schools earn a slot on the list.  West Hartford had three schools named, Braeburn, Bugbbee and Whiting Lane..

Two Capital Region Education Council (CREC) schools made the list, The Ana Grace Academy of the Arts Elementary School and the University of Hartford Magnet School.  CREC renamed one of its magnet schools in 2014 in honor of Ana Grace Marquez-Greene, a former Hartford resident who was among the young victims of the Sandy Hook school shooting.


2015-2016 Schools of Distinction

  • Anna H. Rockwell School, Bethel
  • Frank A. Berry School, Bethel
  • Bolton High School, Bolton
  • Mary R. Tisko School, Branford
  • Brass City Charter School, Waterbury
  • Ana Grace Academy of the Arts Elementary School, Avon
  • University of Hartford Magnet School, West Hartford
  • Chapman School, Cheshire
  • Norton School, Cheshire
  • Lewin G. Joel Jr. School, Clinton
  • M. Wright Technical High School, Stamford
  • Ellsworth Avenue School, Danbury
  • Hayestown Avenue School, Danbury
  • Mill Ridge Primary School, Danbury
  • Morris Street School, Danbury
  • Park Avenue School, Danbury
  • South Street School, Danbury
  • Ox Ridge Elementary School, Darien
  • Royle Elementary School, Darien
  • Tokeneke Elementary School, Darien
  • East Haddam Elementary School, East Haddam
  • Dominick H. Ferrara School, East Haven
  • East Lyme High School, East Lyme
  • Lillie B. Haynes School, East Lyme
  • Niantic Center School, East Lyme
  • Windermere School, Ellington
  • Burr Elementary School, Fairfield
  • Timothy Dwight Elementary School, Fairfield
  • Jennings School, Fairfield
  • Riverfield School, Fairfield
  • East Farms School, Farmington
  • Noah Wallace School, Farmington
  • Union School, Farmington
  • West District School, Farmington
  • Eastbury School, Glastonbury
  • Hopewell School, Glastonbury
  • Nayaug Elementary School, Glastonbury
  • Wells Road Intermediate School, Granby
  • International School at Dundee, Greenwich
  • North Mianus School, Greenwich
  • North Street School, Greenwich
  • Old Greenwich School, Greenwich
  • Parkway School, Greenwich
  • Riverside School, Greenwich
  • Northeast Academy Elementary School, Groton
  • B. Butler School, Groton
  • Guilford Lakes School, Guilford
  • Regional Multicultural Magnet School, New London
  • Litchfield Intermediate School, Litchfield
  • Southeast Elementary School, Mansfield
  • Casimir Pulaski School, Meriden
  • Thomas Hooker School, Meriden
  • Orange Avenue School, Milford
  • Pumpkin Delight School, Milford
  • Oakdale School, Montville
  • Western School, Naugatuck
  • East School, New Canaan
  • New Canaan High School, New Canaan
  • West School, New Canaan
  • Conte/West Hills Magnet School, New Haven
  • Anna Reynolds School, Newington
  • Hawley Elementary School, Newtown
  • Green Acres Elementary School, North Haven
  • Ridge Road Elementary School, North Haven
  • North Stonington Elementary School, North Stonington
  • Wheeler High School, North Stonington
  • Samuel Huntington School, Norwich
  • Thomas W. Mahan School, Norwich
  • Kathleen E. Goodwin School, Old Saybrook
  • Moosup Elementary School, Plainfield
  • Plainfield Central School, Plainfield
  • Plymouth Center School, Plymouth
  • Brownstone Intermediate School, Portland
  • Redding Elementary School, Redding
  • Harwinton Consolidated School, Harwinton
  • Booth Free School, Roxbury
  • The Burnham School, Bridgewater
  • Washington Primary School, Washington Depot
  • Burr District Elementary School, Higganum
  • Haddam Elementary School, Higganum
  • Lyme Consolidated School, Lyme
  • Mile Creek School, Old Lyme
  • Barlow Mountain Elementary School, Ridgefield
  • Branchville Elementary School, Ridgefield
  • Farmingville Elementary School, Ridgefield
  • Ridgebury Elementary School, Ridgefield


  • Scotland Elementary School, Ridgefield
  • Veterans Park Elementary School, Ridgefield
  • West Hill School, Rocky Hill
  • Chatfield-LoPresti School, Seymour
  • Booth Hill School, Shelton
  • Elizabeth Shelton School, Shelton
  • Long Hill School, Shelton
  • Sunnyside School, Shelton
  • South Windsor School District, Pleasant Valley School
  • Eli Whitney School, Stratford
  • Nichols School, Stratford
  • Second Hill Lane School, Stratford
  • Stratford Academy - Johnson House, Stratford
  • Booth Hill School, Trumbull
  • Jane Ryan School, Trumbull
  • Middlebrook School, Trumbull
  • Tashua School, Trumbull
  • Yalesville School, Wallingford
  • Braeburn School, West Hartford
  • Bugbee School, West Hartford
  • Whiting Lane School, West Hartford
  • Edith E. Mackrille School, West Haven
  • Seth G. Haley School, West Haven
  • Daisy Ingraham School, Westbrook
  • Coleytown Elementary School, Westport
  • Green's Farms School, Westport
  • Alfred W. Hammer School, Wethersfield
  • Wilton High School, Wilton
  • B. Sweeney School, Windham
  • Frisbie School, Wolcott


PERSPECTIVE: Is Your School Fresh Check Day Cool?

by Rachel Papke Most people are surprised to learn that suicide is the second leading cause of death for individuals between the ages of 15-24.

The Jordan Porco Foundation’s mission is to prevent suicide, promote mental health, and create a message of hope for young adults. They accomplish this by providing engaging and uplifting peer-run programs on college campuses. Their signature program is Fresh Check Day.

Fresh Check Day is an uplifting mental health promotion and suicide prevention event that includes interactive expo booths, peer-to-peer messaging, support of multiple campus departments and groups, free food, entertainment, and exciting prizes and giveaways.

Fresh Check Day aims to create an approachable and hopeful atmosphere where students are encouraged to engage in dialogue about mental health and helps to build a bridge between students and the mental health resources available.

The program’s primary goals are to:

  • Increase awareness of mental health resources and services available to students
  • Reduce stigma and misconceptions around mental health and suicide that often deter individuals from seeking help
  • Empower peers to be gatekeepers by understanding warning signs and knowing what to do if a friend is exhibiting signs of suicide or a mental health concern
  • Increase willingness to ask for help if experiencing emotional distress

The Jordan Porco Foundation does not charge a fee for service for Fresh Check Day in consideration of varying capacities to fund large-scale mental health programming. Instead, they provide significant support and ask participating schools to provide the remaining essential components within their budgetary means.

This year they experienced incredible growth. They expanded Fresh Check Day to a national reach that includes 14 states, with 58 events this year alone. Currently, they have signed-on 90 schools in 28 states, plus the District of Columbia, and counting.

In Connecticut, 22 institutions are participating, including:  Gateway Community College on April 11, the University of Hartford on April 12, Norwalk Community College on April 19, University of Saint Joseph on April 19, University of Connecticut on April 22, Sacred Heart University on April 28, Three Rivers Community College on September 20, Connecticut College on September 22, Quinnipiac University on October 6, and Central Connecticut State University on October 17.

What can you do?  Bring Fresh Check Day to your school. You can connect with Student Activities, Residential Life, Health Services, your school’s counseling services, or anyone you can think of on campus, and have them get in touch with the Jordan Porco Foundation. Or, you can e-mail the Jordan Porco Foundation at info@jordanporcofoundation.org to introduce yourself, and the programming staff will help you.

“This was an eye opening experience,” said one college participant.  “It helped me feel like I wasn’t alone.”  Added another: “As someone whose mental health had limited my life for some time, I want you to know that these things change lives.  Your event made people feel valued and important and cared about.  You may never hear thank you from everyone that today changed their life but I can promise you our campus is a safe place because of Fresh Check Day.”

_________________________________

Rachel Papke is Communications Coordinator at the Jordan Porco Foundation

The Jordan Porco Foundation is a 501(c) (3) public charity. Their programs strive to start a conversation about mental health that reduces stigma while encouraging help-seeking and supportive behaviors.  Tickets to Jordan’s Journey Gala, their annual event in support of the Jordan Porco Foundation’s lifesaving programs are now available.  The event is on March 25.  Learn more at jordanporcofoundation.org or (860) 904-6041.


Get Ready for April Showers – and More, UConn Researcher Says

A University of Connecticut climate scientist confirms that more intense and more frequent severe rainstorms will likely continue as temperatures rise due to global warming, despite some observations that seem to suggest otherwise. In a research paper appearing this week in the journal Nature Climate Change, UConn civil and environmental engineering professor Guiling Wang explains that data showing the intensity of severe rainstorms declining after temperatures reach a certain threshold are merely a reflection of climate variability. It is not proof that there is a fixed upper temperature limit for future increases in severe rains, after which they would begin to drop off.

"We hope this information puts things in better perspective and clarifies the confusion around this issue," Wang told UConn Today.  "We also hope this will lead to a more accurate way of analyzing and describing climate change," said Wang, who led an international team of climate experts in conducting the study, funded by the National Science Foundation’s Division of Atmospheric and Geospace Sciences.

Climate scientists and policymakers closely monitor severe and prolonged rainstorms as they can have a devastating impact on local environments and economies. These damaging storms can cause catastrophic flooding; overwhelm sewage treatment plants; increase the risk of waterborne disease; and wipe out valuable crops.

Wang says the peaks seen in the observational data and climate models simply reflect the natural variability of the climate. As Earth warms, her team found, the entire curve representing the relationship between extreme precipitation and rising temperatures is moving to the right. This is because the threshold temperature at which rain intensity peaks also goes up as temperature rises. Therefore, extreme rainfall will continue to increase, she says.

"In general, extreme precipitation increases with higher temperatures because the air can hold more moisture -- although that depends on moisture availability. But beyond a certain point, it is the other way round: the temperature responds to the precipitation, or more strictly speaking, the conditions leading to the precipitation, [such as extensive cloud cover or surface moisture],” explained Kevin Trenberth, an expert on global warming and the lead author of several reports prepared by the Intergovernmental Panel on Climate Change (IPCC), who joined Wang in the study.

Trenberth is currently a Distinguished Senior Scientist in the Climate Analysis Section at the National Center for Atmospheric Research. He shared the 2007 Nobel Peace Prize with former Vice President Al Gore as a member of the IPCC.

“The most obvious example of this is in a drought where there is no precipitation. Another example is in cloudy, stormy conditions, when it is wet and cool. By relating the changes in precipitation to the temperature where the relationship reverses -- instead of the mean temperature as in previous studies -- we can make sense of the differences and the changes. Moreover, it means there is no limit to the changes that can occur, as otherwise might be suspected if there were a fixed relationship."

All of which adds up to a soggy future, as climate change continues.

The mission of Dr. Guiling Wang's Hydroclimatology and Biosphere-Atmosphere Interactions Lab at UConn is to understand and quantify the terrestrial hydrological cycle, its variability, changes, and interactions with the society. With a special focus on water, the lab’s research spans the disciplines of climate and atmospheric sciences, hydrology, and plant ecology. They take “an earth system approach, viewing the Earth’s biosphere, atmosphere, and hydrosphere as dynamically coupled components linked through water, energy, and CO2 exchanges,” according to the website summary.

Disparities Evident As Fairfield County Considers Its Community Wellbeing

Fairfield County’s sizeable immigrant population - twenty percent of Connecticut’s most populous county - grew 89 percent from 1990 to 2014. In some municipalities, foreign-born residents make up as much as a third of the population. That is among the findings in the Fairfield County Community Wellbeing Index 2016, which examined regional demographics, economic opportunity, education, health, quality of life, and happiness.  The report includes analysis of the communities, populations, and neighborhoods of Fairfield County, as well as opportunities available and issues facing the area.

Since 1980, the size of the population living in neighborhoods that are considered most affluent – defined as those with an average family income more than 2.5 times higher than the state level - has tripled within Fairfield County. Meanwhile, the number of people living in poor neighborhoods is 3.5 times its 1980 size. The number of people in middle-income neighborhoods has decreased by sixteen percent.

Fairfield County’s Community Foundation, a major funder of the report, partnered with DataHaven, area hospitals, and government agencies to help launch a more robust and comprehensive resource that could serve as a part of the hospitals’ and health departments’ Community Health Needs Assessments as well as a broader county-wide indicators program.

“Fairfield County’s Community Foundation is committed to addressing the most pressing issues facing Fairfield County, but to do that we first need to be able to identify and understand those issues,” stated Nancy M. von Euler, Vice President, Programs, Fairfield County’s Community Foundation. “The data in the Fairfield County Community Wellbeing Index 2016 will help us to develop priorities for collective action to build a stronger, healthier Fairfield County where everyone has the opportunity to thrive, regardless of their zip code.”

The report states that "Despite its overall affluence, Fairfield County is among the nation’s most unequal metropolitan areas. Inequities in well-being appear when evidence is stratified by income, age, race, gender, and zip code. These differences are often most apparent after considering data that were collected specifically for the age groups and neighborhoods that are most impacted."

Among the findings, between 2014 and 2025, adults ages 65 and over are Fairfield County’s only age group projected to grow significantly, with a thirty-seven percent increase. Disparities in the County were also evident:

  • High and rising childcare costs are often prohibitively expensive for low and middle-income families. While Fairfield County has nearly enough spaces for all 3- to 4-year-olds to attend preschool, there are only enough regulated childcare slots for fifteen percent of the county’s children ages 0 to 2, and enough subsidized slots to cover only twenty-two percent of these youngest children in low-income households.
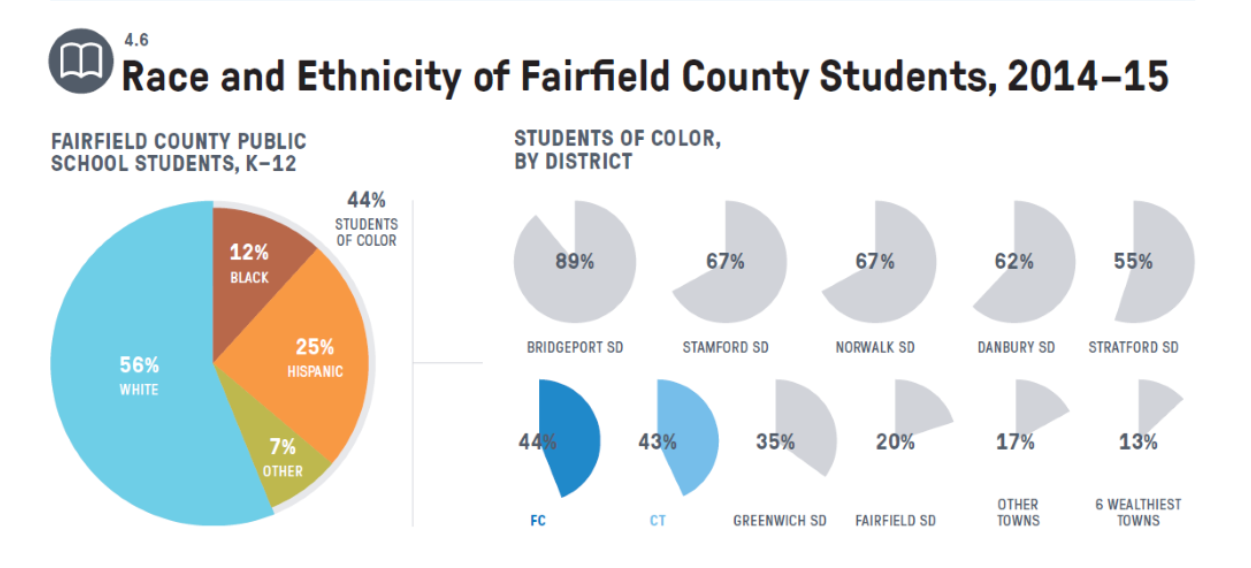
  • The issue of dental care arose as an indicator of well-being, particularly among younger adults and families. The Index shows that for every 10,000 residents living in Fairfield County, 12 residents visit an emergency room to receive treatment for preventable dental conditions in any given year, whereas on the East Side of Bridgeport, 178 residents do.
  • Fairfield County residents are healthy when compared to national benchmarks. However, many conditions and risk factors—such as asthma, food insecurity, exposure to community violence, and the early onset of diabetes—are disproportionately prevalent in lower-income neighborhoods and communities of color. Sections of Bridgeport in particular fall very far behind the surrounding area in many of these measures.
  • Disparities in access to reliable transportation persist between racial and income groups. A majority of Fairfield County workers, regardless of income, commute to another town for work. Many low-income (annual wages under $40,000) workers leave Bridgeport for work, while large shares of high-income workers commute to New York City.

“The process of developing this report allowed local partners and community members to identify links between the well-being of residents and the places where they live. Looking beyond typical measures like income levels or unemployment rates, the Community Wellbeing Index reveals a much more uneven distribution of opportunities in areas such as neighborhood walkability, economic development, public health, and education,” said Mark Abraham, Executive Director of DataHaven and a lead author of the report. “The impact that these barriers to opportunity have on overall well-being and happiness will serve as a call to action for many groups working to improve Fairfield County’s diverse neighborhoods and towns.”

The Fairfield County Community Wellbeing Index 2016 was based on a variety of federal and statewide data sources. Partners of DataHaven’s Fairfield County Community Wellbeing Index 2016 include Fairfield County’s Community Foundation; Bridgeport Hospital; Danbury Hospital; Greenwich Hospital; Norwalk Hospital; St. Vincent’s Medical Center; and Stamford Hospital.

Healthy Eating Not So Great Among Children, Community Can Help

Only one-third of parents of children ages 4-18 feel they’re succeeding at fostering healthy eating habits in their kids, according to a recent national survey.  The University of Michigan C.S. Mott Children’s Hospital National Poll on Children’s Health found that just over half of parents believe their children eat mostly healthy, and only one in six parents rate their children’s diets as “very nutritious,” according to a press release. A fourth of parents polled said their child’s diet is “somewhat or not healthy at all.” Common challenges – not surprisingly - get in the way, according to experts: price, picky eaters and convenience.

“Most parents understand that they should provide healthy food for their children, but the reality of work schedules, children’s activities and different food preferences can make meal preparation a hectic and frustrating experience,” poll co-director Sarah Clark explained. “The tension between buying foods children like, and buying foods that are healthy, can be an ongoing struggle. Many of us know the feeling of spending time and money on a healthy meal only to have our children grimace at the sight of it and not take a single bite.”

Other data from the poll – which involved 1,767 parents – include that one in five parents don’t think limiting their child’s intake of fast food or junk food is important, and that 16 percent said limiting sugary drinks is “somewhat or not important.”

In general, parents of teens were less worried about unhealthy eating habits compared to parents of younger children.

The C.S. Mott Children's Hospital National Poll on Children's Health measures current national public opinion, perceptions and priorities regarding major health care issues and trends for U.S. children and people in their communities.

Also this month, the Rudd Center for Food Policy and Obesity at the University of Connecticut found that residents of one Maryland county bought fewer sugary drinks after a campaign to reduce the consumption of sugar-sweetened beverages that included policy changes and public health outreach efforts.

The Rudd Center study, published in JAMA Internal Medicine, is the first to use objective retail sales data to measure the effectiveness of a community-led campaign to reduce consumption of sugary drinks.

“This study demonstrates the power of a community-based public health campaign that combines health-supporting policy changes with extensive outreach. The residents of Howard County have been engaged in every phase of this effort and their commitment to switching their drinks showed up in the supermarket sales data,” said Marlene Schwartz, Director of the UConn Rudd Center for Food Policy and Obesity, and the study’s lead author.

Beverages with added sugars are among the leading sources of empty calories—calories that supply little or no nutrients—for both children and adults, and overconsumption of sugar is associated with obesity and increased risk of heart disease.

The study’s key findings show that based on sales data from Howard County supermarkets:

  • Sales of sugar-sweetened soda declined nearly 20 percent.
  • Sales of 100 percent juice fell 15 percent.
  • Sales of fruit drinks with added sugars fell a little more than 15 percent.

Comparing sales data in 2012, before the Howard County Unsweetened campaign, to sales data in 2015, researchers found notable declines in purchases over the three-year period.

In determining the campaign’s impact, researchers compared weekly beverage sales of top-selling brands in 15 Howard County supermarkets with a matched group of 17 supermarkets in southeastern Pennsylvania. The study did not include sales data from non-supermarket vendors such as convenience stores.

The Rudd Center for Food Policy & Obesity at the University of Connecticut is a distinguished multi-disciplinary policy research center dedicated to promoting solutions to childhood obesity, poor diet, and weight bias through research and policy.  The study was funded primarily by the Horizon Foundation, with additional funding from the Robert Wood Johnson Foundation, and from the Rudd Foundation to support data collection. Voices for Healthy Kids, a joint initiative of the Robert Wood Johnson Foundation and the American Heart Association, is a strategic partner of both Howard County Unsweetened and Sugar Free Kids Maryland.

CT Ranks 5th in U.S. in Dental Health, Best in New England

The neighboring states of Minnesota, Wisconsin, Illinois and North Dakota have the best dental health in the nation, but Connecticut and Massachusetts break the mid-west logjam, ranking fifth and sixth in a new survey of nearly two dozen dental-health related categories by the financial website WalletHub. Connecticut ranked second in a series of oral health categories and 17th in a group of dental habits and care categories, according to the survey, resulting in the 5th place finish overall.  Connecticut and Massachusetts ranked one-two in the highest percentage of adults who visited a dentist in the past year, and Connecticut placed third, after New Hampshire and Pennsylvania, in the highest percentage of adolescents who visited a dentist in the past year.

Connecticut also topped the list in two additional categories:  Lowest Percentage of Adults Who Experienced Pain in the Past Year Due to Oral Condition and Lowest Sugar-Sweetened Beverage Consumption Among Adolescents.  The state also ranked in a tie for third for having the lowest percentage of elderly population with no natural teeth.

Data used to create the ranking were collected from U.S. Census Bureau, Bureau of Labor Statistics, Centers for Disease Control and Prevention, Healthy Grid, American Dental Association, Health Resources & Services Administration, Medicaid and CHIP Payment and Access Commission, American Academy of Pediatric Dentistry and Oral Health America, according to WalletHub.

With the state’s ranking in the background, the Connecticut Oral Health Initiative (COHI) will host a session on health equity during Oral Health Day at the State Capitol on Wednesday, March 8, from 10 am to 3 pm in the Legislative Office Building.

Connecticut oral health-related organizations will on hand throughout the day to raise awareness and educate decision-makers and the public about policies to improve the oral health of Connecticut residents. The organization’s focus this year is on preserving Medicaid coverage for adults and children, allowing children to remain on their parents' dental insurance until age 26, and integrating oral health into health systems.

Other legislative initiatives include a proposal to increase the number of adults aged 19 to 26 years covered by dental insurance to provide continuity of dental care into adulthood, and another to decrease the incidence of oral and other cancers by decreasing tobacco use by Connecticut residents. By raising the Legal Age For Purchase and Use of Tobacco Products.

COHI leads and collaborates in statewide oral health advocacy efforts; promotes the necessity of oral health to overall health; serves as an expert resource on oral health policy; and publicizes oral health policy analysis and recommendations.

Also at the Capitol, the Department of Public Health is proposing a mandate for dental hygienists to have at least one contact hour in cultural competency prior to the renewal of their license, as part of the commitment to health equity.