Seniors Better Off Than Other Adults in CT; State’s Ranks #6 in Senior Advantage

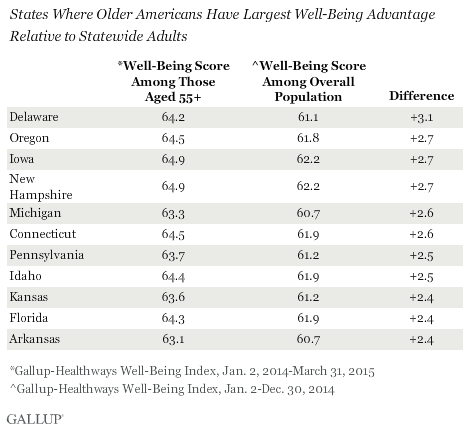
Older adults living in Delaware have the largest well-being advantage relative to the overall state population, followed closely by Oregon, Iowa, New Hampshire, Michigan and Connecticut.  A new state-by-state comparison examines the comparative well-being of Americans age 55 and older, and reveals that, nationally, people in that age category have higher well-being than the rest of the population. The inaugural report is based on data from the Gallup-Healthways Well-Being Index®. The growing percentage of the American population over the age of 55 — a trend largely driven by the Baby Boomers entering later life — has important implications for a variety of stakeholders, including families, employers, healthcare providers and policymakers, according to the report’s authors. “State Well-Being Rankings for Older Americans” aims to fill the research gap.older-americans-cover-thumb
The report focuses on five elements of well-being: purpose, social, financial, community and physical. These five elements, according to Gallup and Healthways, create a composite picture of the well-being of older Americans in each state.  rankingsThe Well-Being Index is calculated on a scale of zero to 100, where zero represents the lowest possible well-being and 100 represents the highest possible well-being.  Connecticut’s well-being score was 64.5 for those age 55+, compared with 61.9 for the overall adult population.  The difference of 2.6 was the sixth highest among the states.
The state where older Americans' well-being advantage is smallest is Wyoming, followed by Alaska, Oklahoma, Nevada, South Dakota, Maine and Vermont.

In an absolute sense, Hawaii, Montana, South Dakota, Alaska and Iowa are the top five states for overall well-being for older Americans -- states that also have high well-being rankings for the overall population.  The next five: New Hampshire, Utah, Oregon, New Mexico and Connecticut.

That places Connecticut in the top 10 in the overall rankings for well-being for older residents, and for the well-being advantage its seniors have above the overall adult population in the state.  Connecticut has the 7th oldest population in the nation. GallupHW_WBI_2C

States with the lowest well-being for older Americans are also those where well-being as a whole tends to lag behind the rest of the country: West Virginia, Kentucky and Oklahoma. . The report is based on self-reported data from 114,388 interviews with individuals age 55 and older, and was conducted in conjunction with the Massachusetts Institute of Technology (MIT) AgeLab.

“The greatest success of humankind is longer life. The challenge today for families and society is how to live longer, better with the highest state of well-being,” said Joseph F. Coughlin, director and founder of the MIT AgeLab. “Understanding our aging population, including Baby Boomers, the largest generation in our nation’s history, will be critical as we design policies and interventions to help older Americans thrive in all aspects of their lives.”

Connecticut, New England Have Lowest Church Attendance, Survey Says

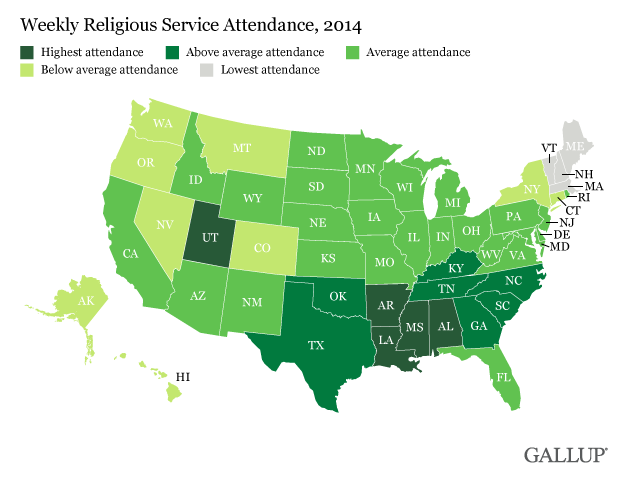
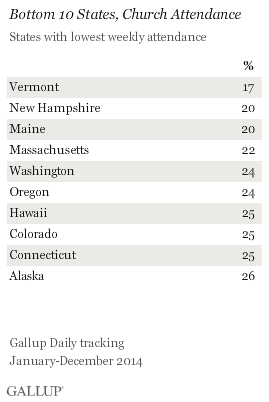
Connecticut residents rank #41 in the nation in regular church attendance, according to a new survey.  The state had plenty of company from New England neighbors at the bottom of the list.  The bottom four slots were occupied by New England states – Vermont at #50, New Hampshire at #49, Maine at #48 and Massachusetts at #47. Rhode Island ranked at #34. In the survey by the Gallup organization throughout 2014, slightly more than half of Utah residents say they attend religious services every week, more than any other state in the union. Residents in the four Southern states of Mississippi, Alabama, Louisiana and Arkansas are the next most likely to be frequent church attendees, with 45 percent to 47 percent reporting weekly attendance.framed church Lee, MA

At the other end of the spectrum is Vermont, where 17 percent of residents say they attend religious services every week.  In Connecticut, 25 percent say they attend religious services weekly.  In addition, 19 percent say they attend nearly weekly or monthly, and 54 percent say they seldom or never attend religious services.

The results are based on Gallup Daily tracking interviews throughout 2014 with 177,030 U.S. adults, and reflect those who say "at least once a week" when asked, "How often do you attend church, synagogue or mosque -- at least once a week, almost every week, about once a month, seldom or never?"

Church attendance self-reports are estimates, Gallup notes, and “may not reflect precise week in and week out attendance, but provide an important measure of the way in which Americans view their personal, underlying religiosity.”

Gallup concludes that “within the U.S. there religious services mapare stark geographic differences in religiosity. In some states of the union -- Utah and Southern states -- roughly half of residents report attending religious services weekly, while in others -- mostly in the Northeast and the West -- a fourth or less of residents attend weekly.”
Ten of the 12 states with the highest self-reported religious service attendance are in the South, along with Utah and Oklahoma, according to the Gallup survey. “The strong religious culture in the South reflects a variety of factors, including history, cultural norms and the fact that these states have high Protestant and black populations -- both of which are above average in their self-reported religious service attendance,” Gallup noted in an analysis of the data.zonvslpedusjhk_03s9f8g

Utah's No. 1 position on the list, Gallup indicated, “is a direct result of that state's 59% Mormon population, as Mormons have the highest religious service attendance of any major religious group in the U.S.”

In Vermont, 71 percent of respondents indicated they “seldom or never” go to religious services.  That percentage was 65 percent in Maine, 63 percent in New Hampshire, 59 percent in Massachusetts, 54 percent in Connecticut and 53 percent in Rhode Island.

Connecticut Residents Economic Confidence Exceeds National Average

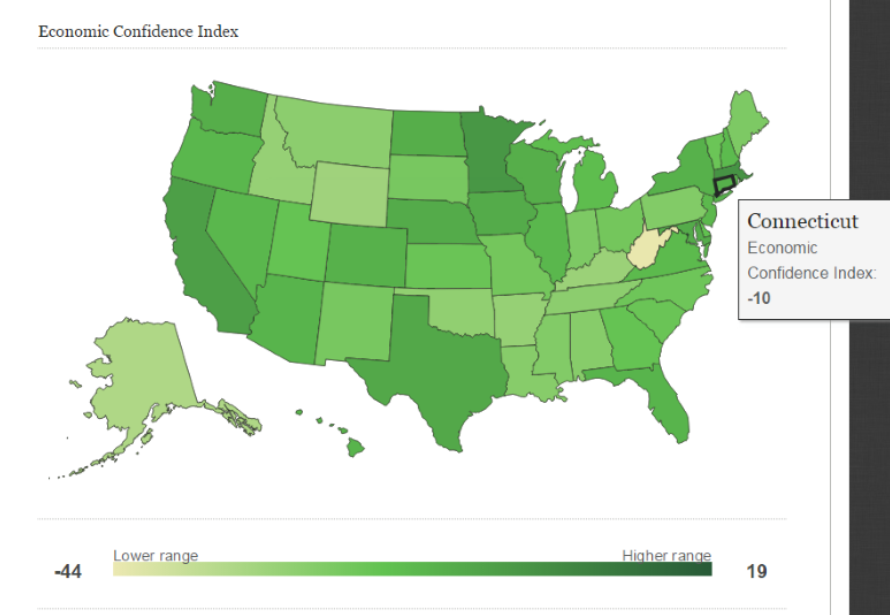
Connecticut ranks tied for 8th among the states in an “economic confidence” index compiled by Gallup Analytics, with residents more optimistic about the nation’s economy than the national average. According to the survey data, no state's residents have a positive outlook when it comes to “economic confidence.”  The states whose residents are the least negative are Massachusetts (-1 in the index), Minnesota (-2), California (-5) and Texas (-8).  The national average is -16 on the Gallup index.

Rounding out the top ten in economic confidence are the states of Nebraska, Maryland and Iowa, tied at -9, and the states of Wisconsin, Washington, North Dakota, and Connecticut, tied for 8th at -10.gallup

The Gallup data was compiled in 2013. Gallup's Economic Confidence Index is based on the combined responses to two questions, the first asking Americans to rate economic conditions in the country, and second, whether they think economic conditions in the country as a whole are getting better or getting worse.states

At the bottom of the list, with the least economic confidence among residents, were West Virginia (-44), Alaska (-32), Wyoming (-29), Kentucky (-28), Arkansas (-27) and Idaho (-27).

Connecticut residents had stronger economic confidence than other states’ residents in the region, with the exception of Massachusetts.  New York (-11), New Jersey (-13), Rhode Island (-12), Vermont (-18), New Hampshire (-14) and Maine (-22) residents had less positive attitudes toward the nation's economy.

The Gallup Index is computed by adding the percentage of Americans rating current economic conditions (("excellent" + "good") minus "poor") to the percentage saying the economy is ("getting better" minus "getting worse"), and then dividing that sum by 2.

Unlike the 50 states, Washington, D.C. reflected economic confidence in the positive range, at 19.

The Index has a theoretical maximum value of +100 and a theoretical minimum value of -100. Values above zero indicate that more Americans have a positive than a negative view of the economy; values below zero indicate net-negative views, and zero indicates that positive and negative views are equal.

Gallup's most recent economic confidence index for the entire nation was slightly improved from a year ago, now at -12.  A breakdown by states was not available.